
Elasticsearch Use Case Guide 4
Detect Outbound Connections to Threat Infrastructure
Detect Outbound Connections to Threat Infrastructure
Overview
Internal corporate assets should not initiate outbound connections to internet infrastructure known to be malicious. When they do, it signals something far more serious than a misconfigured firewall rule - it means a device inside your network is actively reaching out to the threat actor, not the other way around.
This pattern bypasses traditional perimeter defenses and is often a strong indicator of compromise - active C2 beaconing, data exfiltration, or botnet participation.
The GreyNoise Solution
By correlating outbound network telemetry with GreyNoise malicious and suspicious IP indicators within Elasticsearch, this use case identifies internal hosts successfully communicating with known malicious infrastructure.
The detection logic surfaces internal assets making outbound connections to GreyNoise classified malicious or suspicious IPs associated with active exploitation infrastructure, botnet activity, scanners, or command-and-control servers.
The result is a high-fidelity, low-noise detection workflow that enables SOC analysts to quickly identify potentially compromised systems without manually researching suspicious IP activity.
The Core Signal: Any successful outbound connection from an internal asset to GreyNoise-classified malicious or suspicious infrastructure should be treated as a high-priority security event and investigated immediately for indicators of compromise.
Prerequisites
Ensure your environment meets these prerequisites before beginning the setup:
Tools and Access
| Prerequisites | Details |
|---|---|
| Elasticsearch / Elastic Stack | An Elastic Stack deployment with required permissions. |
| GreyNoise API Key | GreyNoise API key to configure GreyNoise integration. |
| GreyNoise Integration | A successfully installed GreyNoise integration, with GreyNoise threat intelligence data being collected. |
| Log Fields | Logs must contain: Source IP (source.ip), Destination IP (destination.ip) |
Implementation Steps
To achieve the use case, follow the steps below:
Step 1: Verification of the GreyNoise Data Ingestion
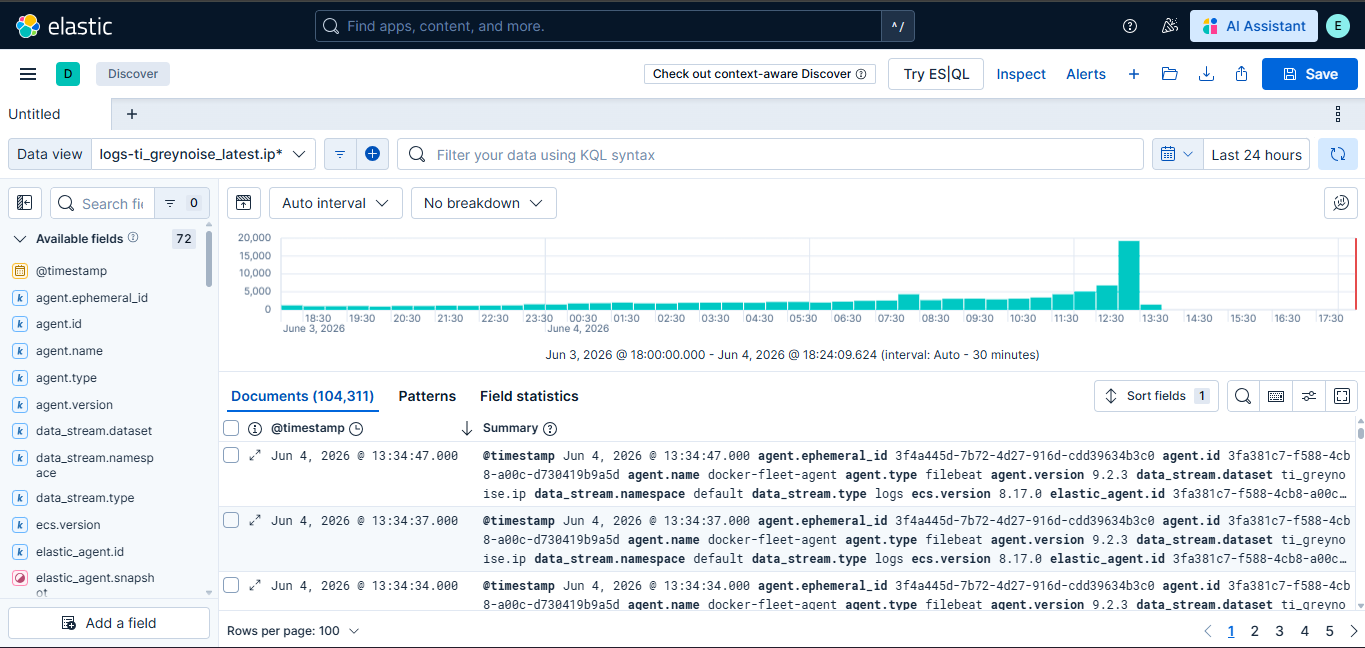
To verify successful GreyNoise data ingestion in Elasticsearch, check the logs-ti_greynoise_latest.ip* data stream in Kibana Discover.
Expected Result: You should see documents containing GreyNoise threat intelligence and enrichment data.
Step 2: Verify if Network Connection Logs exist in the instance
Confirm that your network connection logs are present in Elasticsearch. In Kibana Discover, under your relevant data view, run the following KQL query:
event.category: "network"Expected Result: You should see firewall or network events populated in the results panel before proceeding. Validate that the returned events contain a populated destination.ip field, as these IP fields are used for GreyNoise enrichment and correlation. Also, verify that fields such as network.direction are present in the result set.
Step 3: Create Detection Rule
Create an Elastic Security detection rule in Elasticsearch that correlates outbound network events with GreyNoise threat intelligence indicators. The rule should detect successful outbound connections originating from internal assets communicating with IPs classified by GreyNoise as malicious or suspicious.
Steps to create a detection rule:
-
Navigate to Security > Rules > Detection Rules and click Create New Rule.
-
Select Indicator Match as the rule type and make the following changes.
-
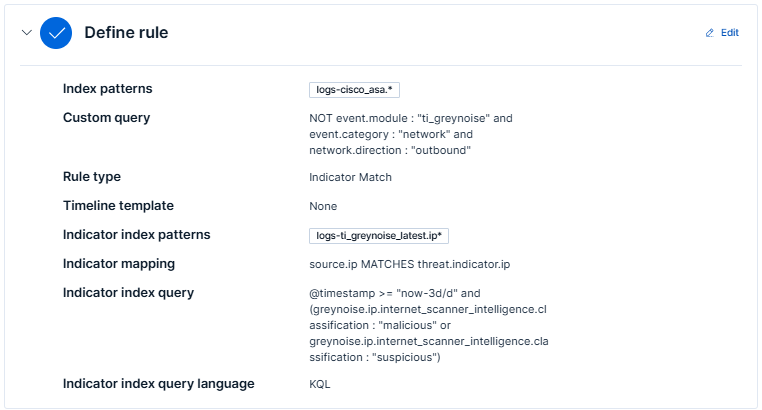
In the Define Rule section:
-
Index Pattern: Add the index pattern relevant to the data you want to monitor. For best results, use perimeter or network traffic data, such as firewall, IDS/IPS, VPN, proxy, or network flow logs (for example,
logs-panw.*,logs-cisco_asa.*, orlogs-suricata.*). Keep the pattern as specific as possible for better performance. -
Custom Query: The following KQL query filters outbound network connection events while excluding GreyNoise integration logs. It identifies outbound traffic initiated by internal assets that is eligible for GreyNoise threat intelligence correlation.
NOT event.module : "ti_greynoise" and event.category : "network" and network.direction : "outbound"
-
-
Indicator index patterns: Use
logs-ti_greynoise_latest.ip*. -
Indicator index query: The following KQL query filters GreyNoise threat intelligence indicators collected within the last 3 days and retains only IPs classified as malicious or suspicious. These indicators are used to correlate against inbound network traffic events during detection.
@timestamp >= "now-3d/d" and (greynoise.ip.internet_scanner_intelligence.classification : "malicious" or greynoise.ip.internet_scanner_intelligence.classification : "suspicious") -
Indicator Mapping:
- Field: Map to the field in your Elastic environment containing IPs, e.g.,
destination.ip. - Indicator Index Field:
threat.indicator.ip
- Field: Map to the field in your Elastic environment containing IPs, e.g.,
-
Required fields (Optional): Add
threat.indicator.ip. -
Related integrations (Optional): Add GreyNoise.
-
In the About Rule section:
-
Name: e.g
UC4 - Outbound Connection to Threat Infrastructure (GreyNoise).
-
-
Description: e.g
Detects internal hosts making outbound connections to IPs classified as malicious by GreyNoise - a strong indicator of active C2 beaconing, data exfiltration, or botnet participation.
-
Default Severity: e.g.,
critical. -
Default risk score: 100
-
Tags: Add
GreyNoise(used for filter Alerts generated by this rule by rule transforms),NetworkandThreat Intelligence. -
Max alerts per run: Default is 100; configurable up to 1000.
-
Indicator prefix override: Set to
greynoise.ipto enrich alerts with GreyNoise data.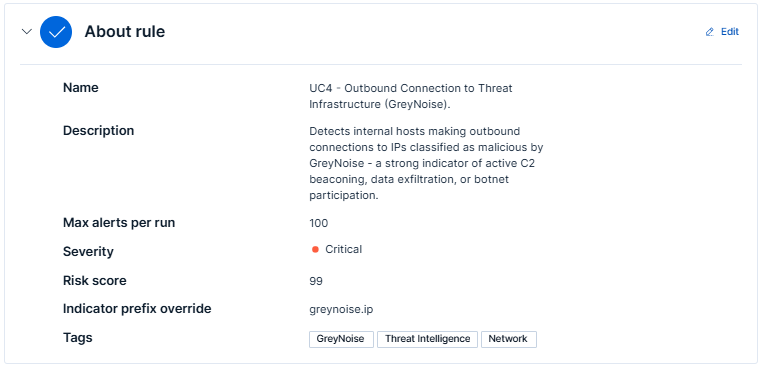
-
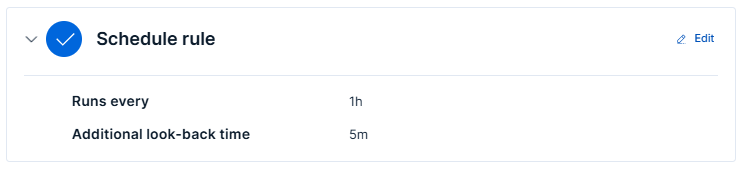
In the Schedule Rules section:
-
Set Runs Every - Defines how frequently the rule runs.
-
Additional Lookback Time - Specifies how far back to check for matches.
-
-
Under the Rule Actions section, configure automated response actions to execute whenever the detection rule generates an alert. (Optional)
-
Click on Create & enable rule.
Steps to view alerts
-
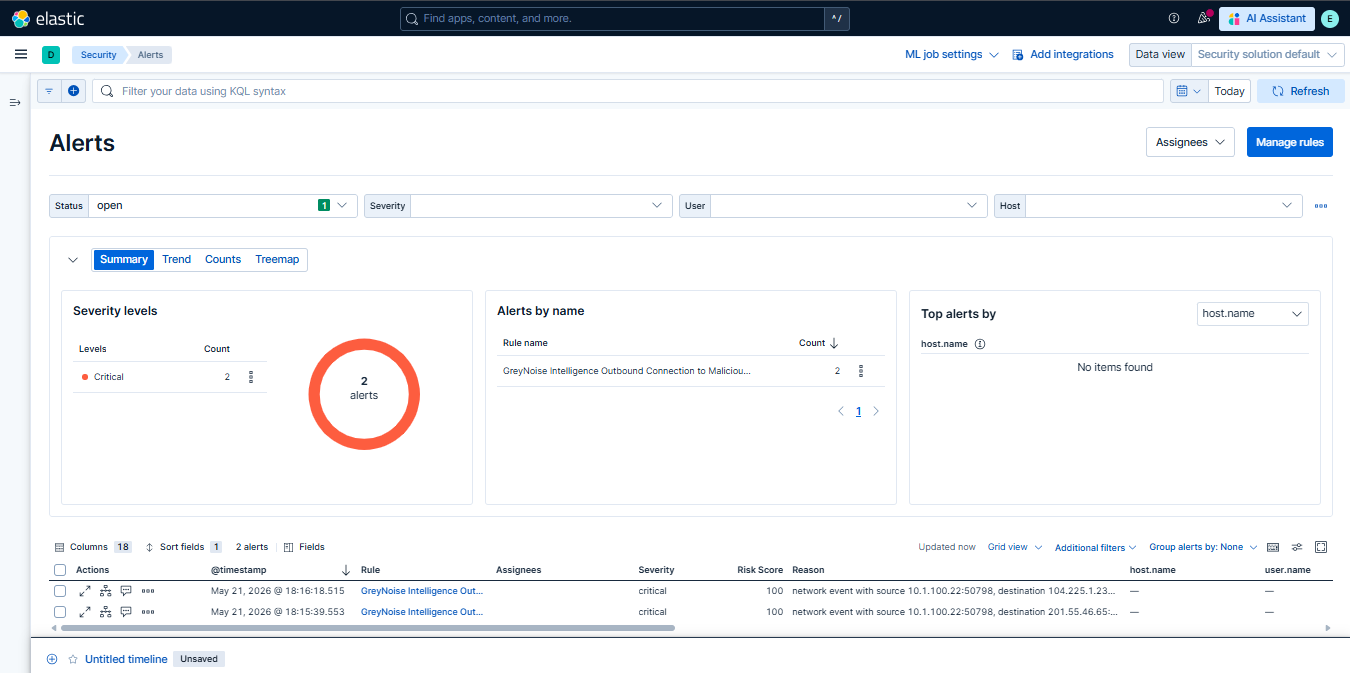
Once the rule is saved and enabled, alerts will appear in the Security > Alerts section when matches are detected.
-
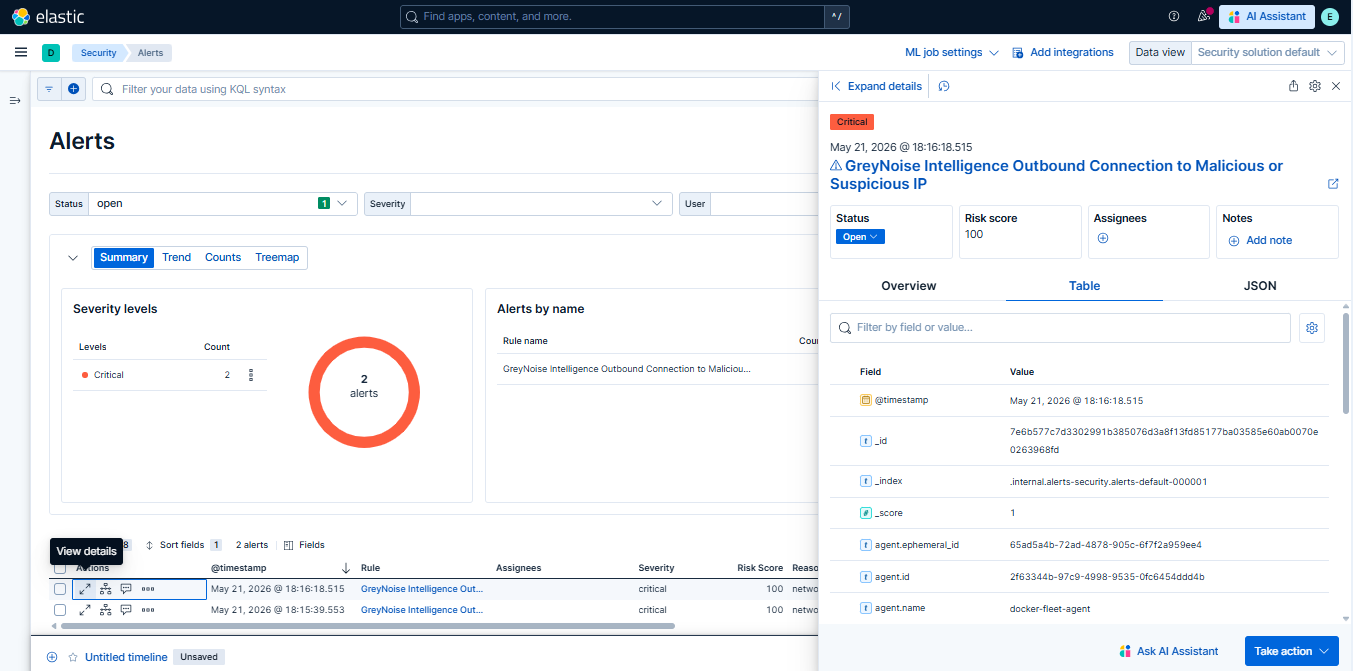
To view the details of the Alert, click on the

icon, then on the Alert viewer tab, click on Table.
Understanding the Output
The Elastic Security detection rule correlates outbound network connection events against GreyNoise threat intelligence indicators and applies the following logic:
- Targets outbound network connections initiated by internal assets.
- Correlates destination IPs against GreyNoise malicious and suspicious IP indicators.
- Filters out benign internet traffic and surfaces only outbound connections to infrastructure classified by GreyNoise as malicious or suspicious.
- Enriches alerts with investigation context, including:
- Internal source IP and hostname
- External destination IP and port
- Network protocol and direction
- GreyNoise classification and actor context
- ASN and geographic information associated with the destination IP
Result: Out of 43 outbound events, only 2 IPs are left for investigation. From many outbound connection events, a confirmed list of internal IPs contacting known malicious infrastructure are identified. Each alert represents an internal host that has actively and successfully reached out to C2, exploitation, or botnet infrastructure — warranting immediate investigation for indicators of compromise.
Results and Impact
Before vs After GreyNoise
| Before GreyNoise | After GreyNoise |
|---|---|
| Hundreds of raw outbound events | A small set of internal hosts with confirmed malicious connections |
| No context - just destination IPs with no threat classification | Destinations classified as malicious inline |
| An analyst must manually investigate every outbound connection | Single host pre-identified with confirmed threat destinations |
| High alert fatigue - outbound traffic includes legitimate services and updates | Low noise - only confirmed malicious destinations retained |
| Minutes to hours, depending on analyst workload | Immediate - one result, and pre-validated |
| Limited to what the analyst manually checks | All outbound events are correlated to GreyNoise indicators in a single pass |
Benefits for the SOC Team
-
Flips the perspective - instead of watching what comes in, this use case watches what your internal hosts are reaching out to, catching compromised hosts that may have already bypassed perimeter controls.
-
Immediate compromise indicator - an internal host connecting to confirmed malicious IPs is one of the strongest signals of active infection or C2 activity.
-
Reduces noise significantly - hundreds of raw outbound events reduced to a small number of internal hosts worth investigating, with connection count and threat destinations pre-compiled.
-
Pivot-ready - Source IP identifies the exact internal host to isolate, and Threat Destinations provides the malicious destinations to block at the perimeter.
Conclusion
Outbound connections to malicious infrastructure are one of the clearest post-compromise signals available - but only if you have the intelligence to recognize the destination. Standard egress monitoring cannot make that determination from raw logs alone.
GreyNoise not only adds intelligence to your alerts but also eliminates those that are not worthy of investigation in the first place. By correlating outbound events with GreyNoise Indicators, your SOC team goes from looking at hundreds of raw outbound events without context to a small number of internal hosts making confirmed connections to malicious infrastructure - the clearest possible signal of an active compromise.
Updated about 1 month ago