
Session Explorer
Session Explorer is the traffic analysis interface for Project Swarm. It gives you full visibility into every connection hitting your honeypot sensors — queryable, filterable, and inspectable down to the raw packet level. This guide walks you through how to use it.
Getting to Session Explorer
- Login to viz.greynoise.io
- Click on Observe --> Explore
Tip: Session Explorer defaults to the last 6 hours of traffic across all your sensors. If you’ve just deployed a new sensor, give it a few minutes to start seeing data.
Understanding the Interface
The Session Explorer is organized into several key areas:
Top Bar
- Query bar: where you type your search query
- Time range selector: defaults to “Past 6 hours” but fully customizable
- Search button: executes your query
- Help icon (?): opens the Query Reference panel with all available fields and query patterns
- Refresh button: re-runs the current query
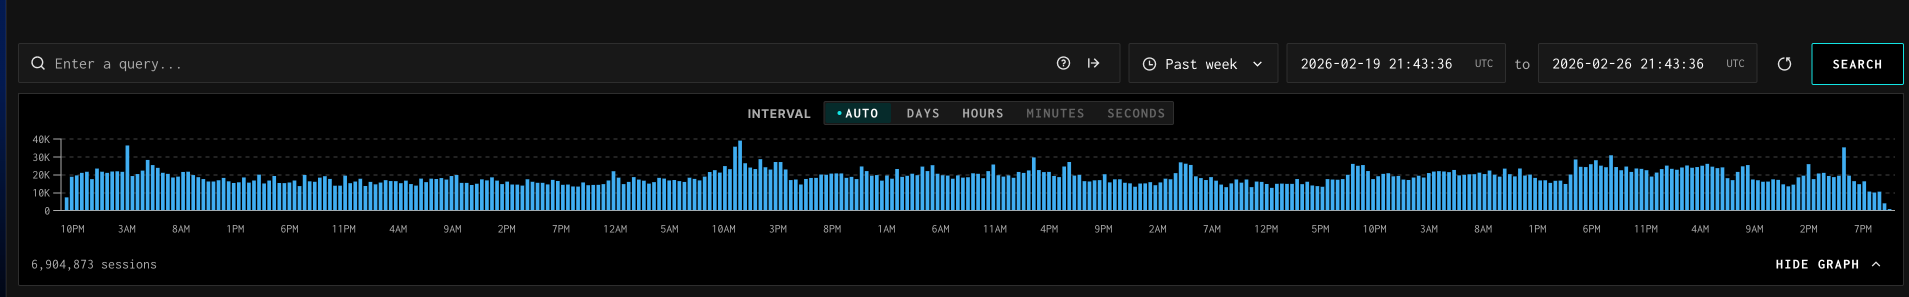
Time Series Graph
The chart at the top shows session volume over your selected time window. You can:
- Toggle the interval between Auto, Days, Hours, Minutes, and Seconds
- Click on a spike or bar to drill into that specific time window — the query will automatically update to filter to that time range
- Hide the graph entirely using the Hide Graph button in the top right of the chart area
Sessions Table
Every row in the table represents a single network session captured by your sensors. Sessions are sorted with the most recent first. Pagination controls appear at the bottom of the table. Use the Items Per Page selector to control how many rows load at once, and the Prev/Next arrows to move through pages.
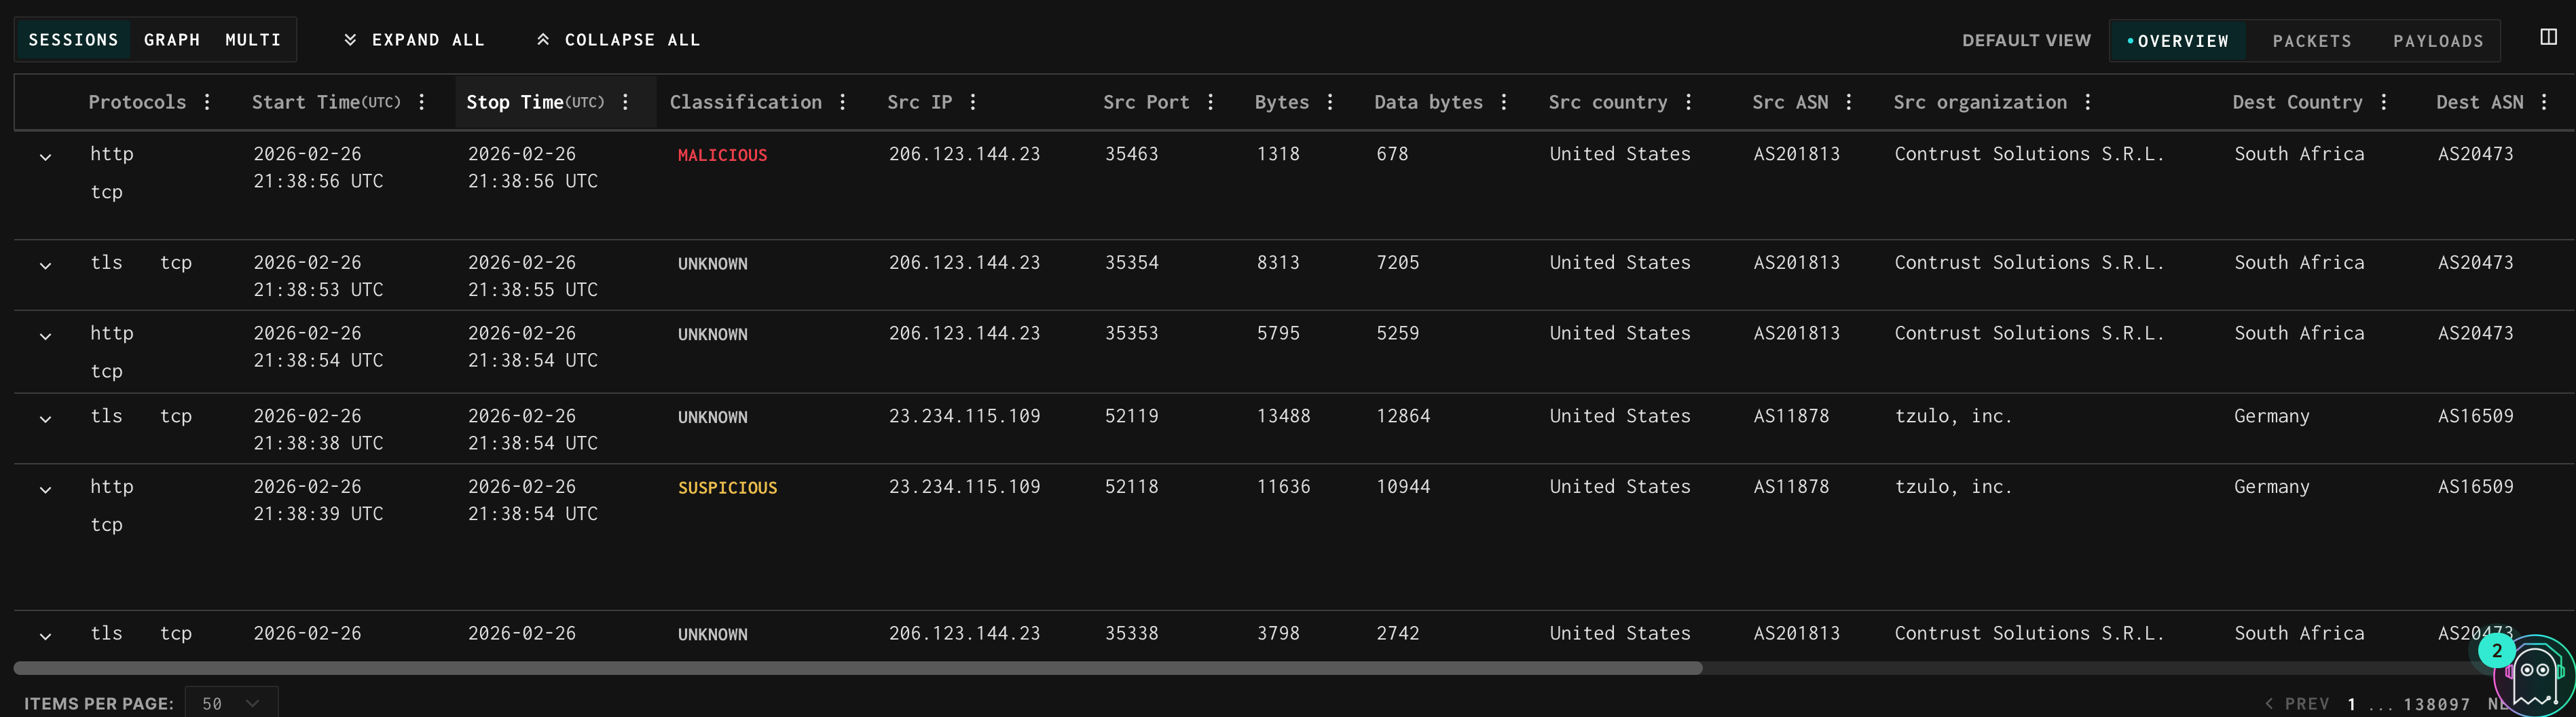
View Modes
Three tabs control what you see below the chart:
- Sessions: the default table view of individual sessions
- Graph: visualizations (time series, treemap, counts, connection maps)
- Multi: a 2x2 dashboard showing multiple charts side-by-side
Default Session View
The Default View label and the Overview / Packets / Payloads tabs next to it control what tab is active by default when you expand any session row. Think of it as a sticky preference: if you select Payloads here, every session you click open will land on the Payloads tab automatically instead of Overview.
- Overview — expanded sessions open on the Overview tab (session metadata and GreyNoise context)
- Packets — expanded sessions open directly on the Packets tab (raw packet viewer)
- Payloads — expanded sessions open directly on the Payloads tab (extracted payload data)
This is especially useful when doing focused review work — for example, set it to Payloads when you want every session you open to immediately show payload content without clicking the tab each time.
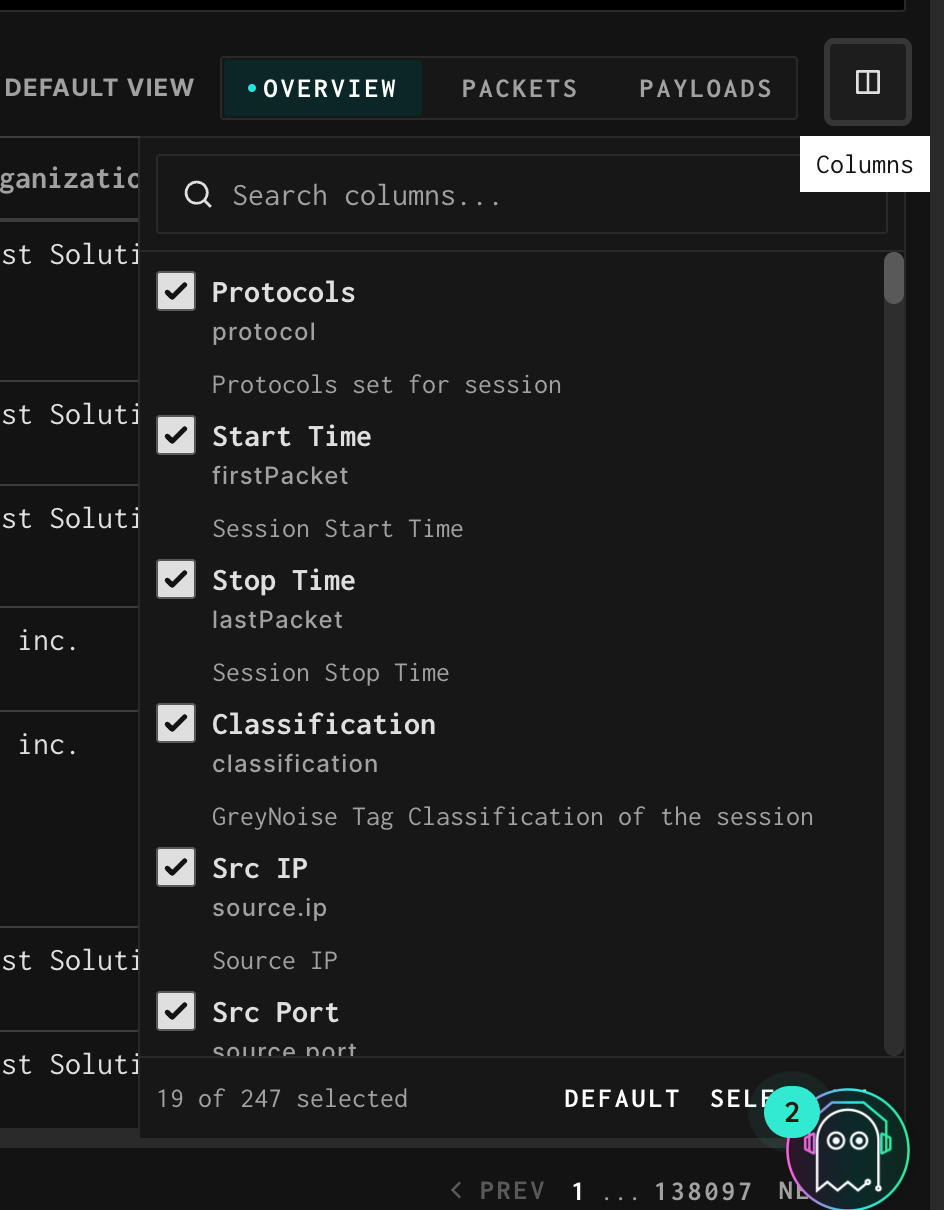
Customizing Your Columns
You’re not limited to the presets. Click the column selector icon (the grid/table icon at the far right of the preset bar) to open the column picker. From here you can:
- Search across all available fields by name using the search box at the top
- Check or uncheck any field to add or remove it as a column in the table
- See the field’s technical name (e.g., source.ip) and its description directly in the picker
- Reset to the default column set at any time using the Default button at the bottom of the picker
- The status bar at the bottom shows how many columns are currently selected (e.g., “21 of 226 selected”)
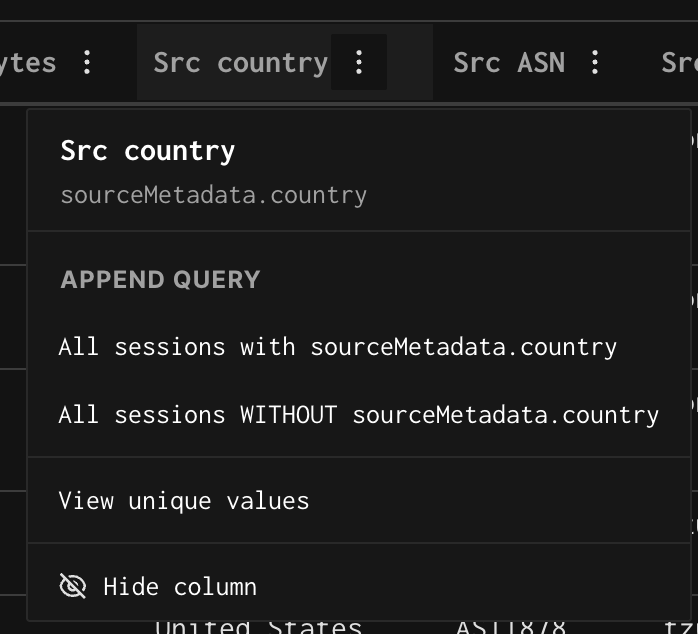
Column Header Menu
Every column header has a clickable menu (click the 3 dots by the column name) that gives you quick actions without needing to type a query:
- Field label and technical name: shown at the top of the menu for reference
- All sessions with [field]: appends a filter requiring this field to be present
- All sessions WITHOUT [field]: appends a negation to exclude sessions missing this field
- View unique values: opens a breakdown of all distinct values for that field across your current result set
- Hide column: removes this column from the table (it stays in your data, just not displayed)
- You can also click a specific cell value anywhere in the table to get filter options scoped to that exact value — for example clicking a specific Src IP will offer “All sessions with source.ip:1.2.3.4” as a one-click filter.
Updated 4 months ago