
Compare
Using the Compare Feature in Project Swarm
The Compare feature lets you measure what your deployed sensors are seeing against GreyNoise’s Global Observation Grid (GOG) so you can identify IPs that are uniquely targeting your infrastructure versus conducting broad internet-wide scanning.
Prerequisites
Before using Compare, make sure you have:
- An active GreyNoise account with at least one deployed sensor
- Sensor traffic collected in your workspace (the Compare feature operates on data collected in your workspace)
Navigating to Compare
The Compare page lives under the Observe tab in the GreyNoise Visualizer.
- Log in to the GreyNoise Visualizer at viz.greynoise.io
- Navigate to the Observe --> Compare
Setting Up a Comparison
Once on the Compare page, you’ll see two workspace selector dropdowns at the top of the screen.
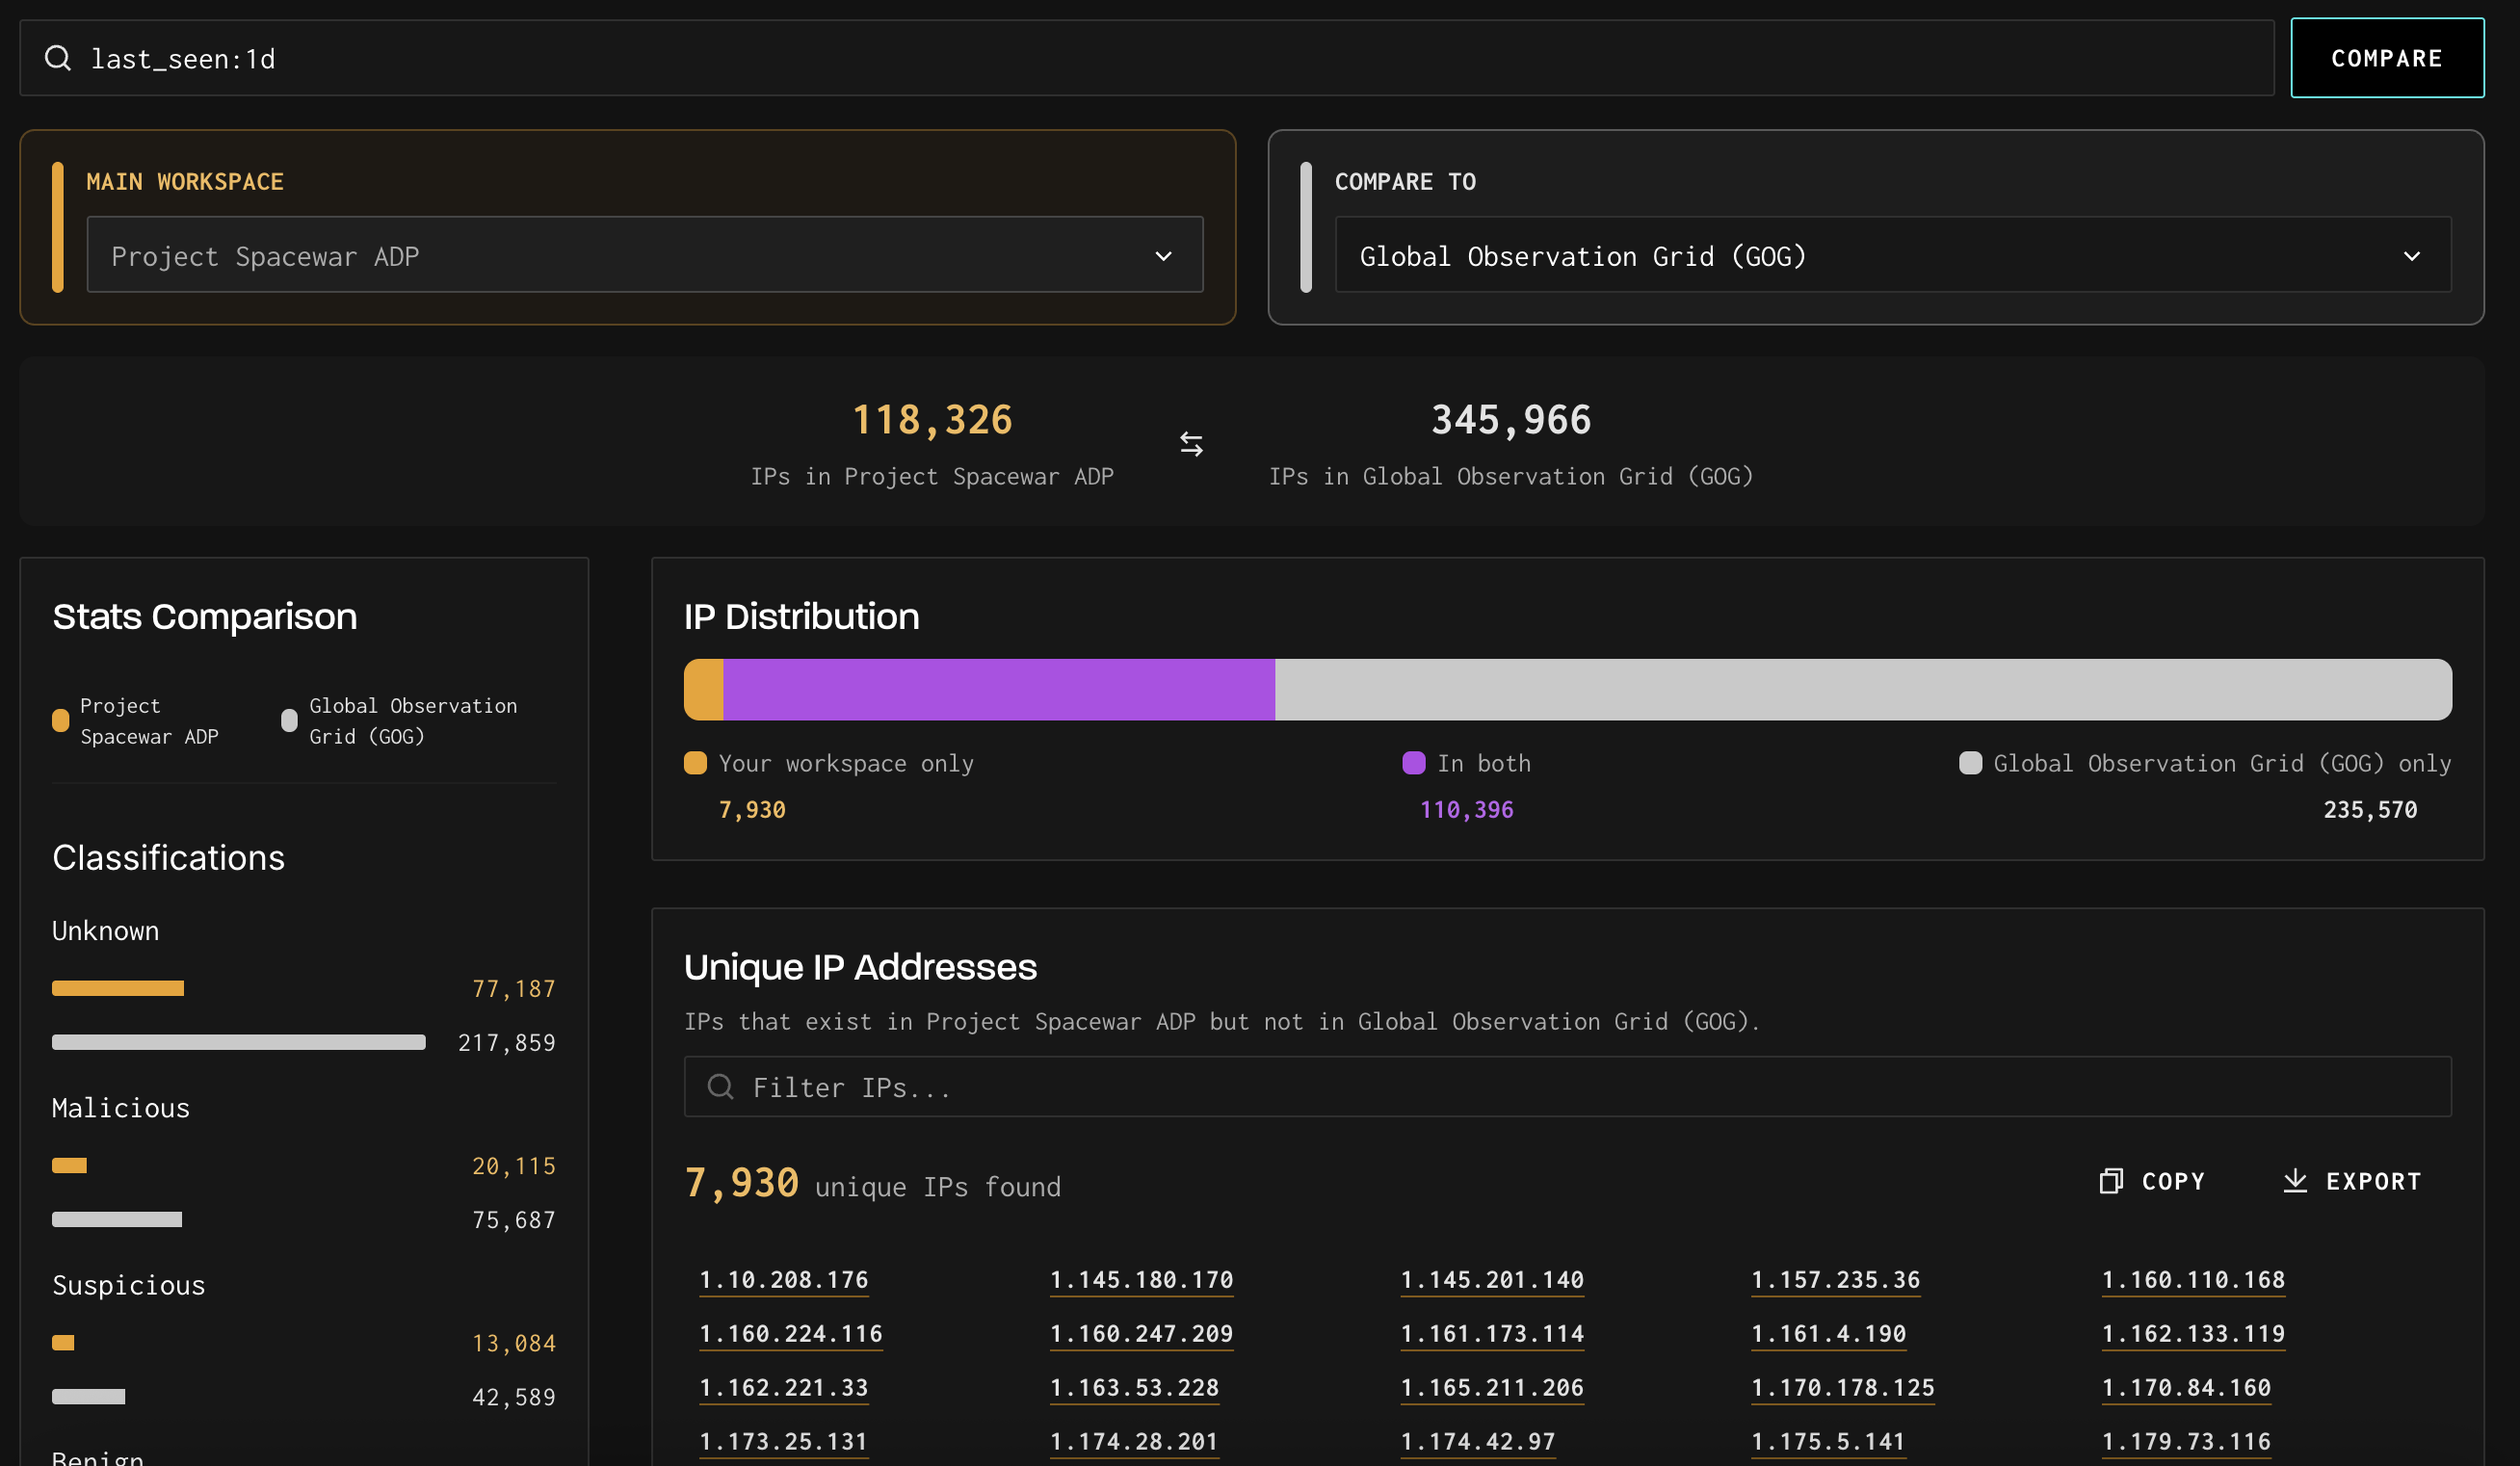
- Main Workspace (left panel, highlighted in orange) is your reference point. This is the workspace you are in.
- Compare To (right panel) is the workspace you want to measure against. By default, this is set to Global Observation Grid (GOG), which is GreyNoise’s production sensor network.
Applying a GNQL Filter
The search bar at the top of the page accepts standard GNQL queries and filters the data used in the comparison. For example, entering last_seen:1d scopes the comparison to IPs observed in the last 24 hours.
After entering a query, click Compare to run the analysis. For longer lookback periods (for example last_seen:30d or last_seen:90d), expect a longer processing period while the comparison calculates.
The Unique IP Addresses list displays up to the first 1,000 IPs. The full count is shown in the IP Distribution card. Use the Export function to retrieve the complete dataset.
Note: If you do not specify a lookback period, it defaults to the maximum number of days included in your subscription. Specifying a shorter lookback period is recommended, as larger ranges can impact query performance.
Reading the Results
IP counts and distribution
At the top of the results view, you’ll see two numbers: the total IPs in your workspace and the total IPs in the comparison workspace (e.g., GOG). Below that, the IP Distribution bar breaks down the overlap into three segments:
- Your workspace only (orange): IPs seen by your sensors but not by GOG. These are your most actionable IPs: potential targeted attacks that bypassed GreyNoise’s global sensor network.
- In both (purple): IPs seen by both your sensors and GOG. These represent broad internet-wide scanning activity.
- Compare To only(gray): IPs in GOG that your sensors did not see.
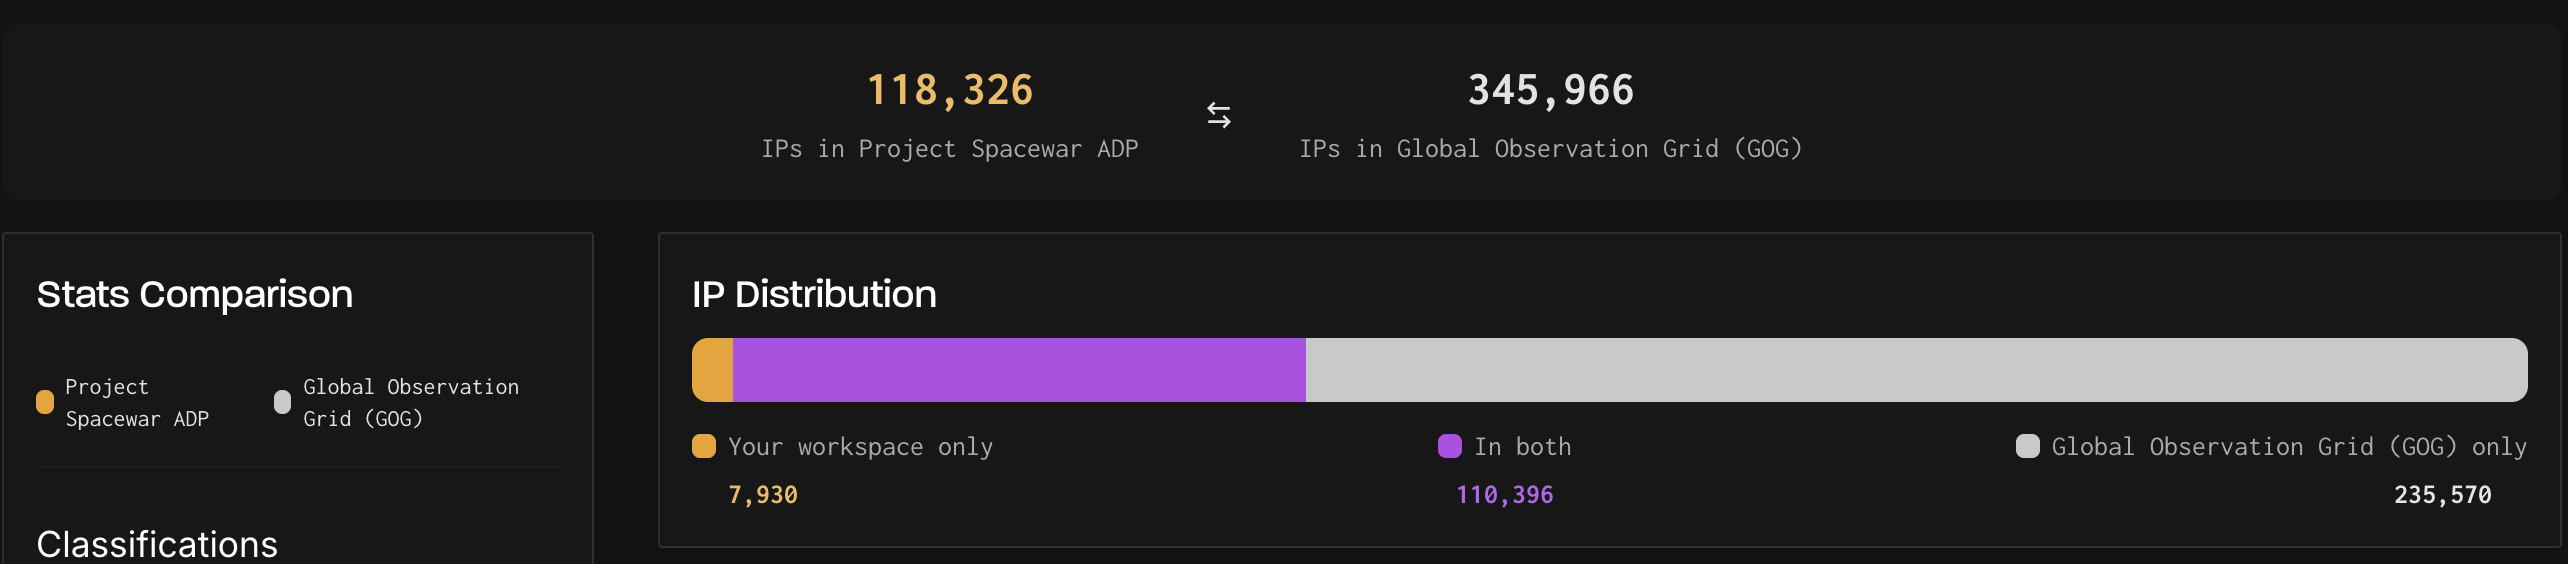
Stats Comparison
The left panel shows a side-by-side breakdown of Classifications (Unknown, Malicious, Suspicious, Benign), Tags, ASNs, Categories, and more for both workspaces. Each row displays an orange bar for your workspace count and a gray bar for the comparison workspace count.
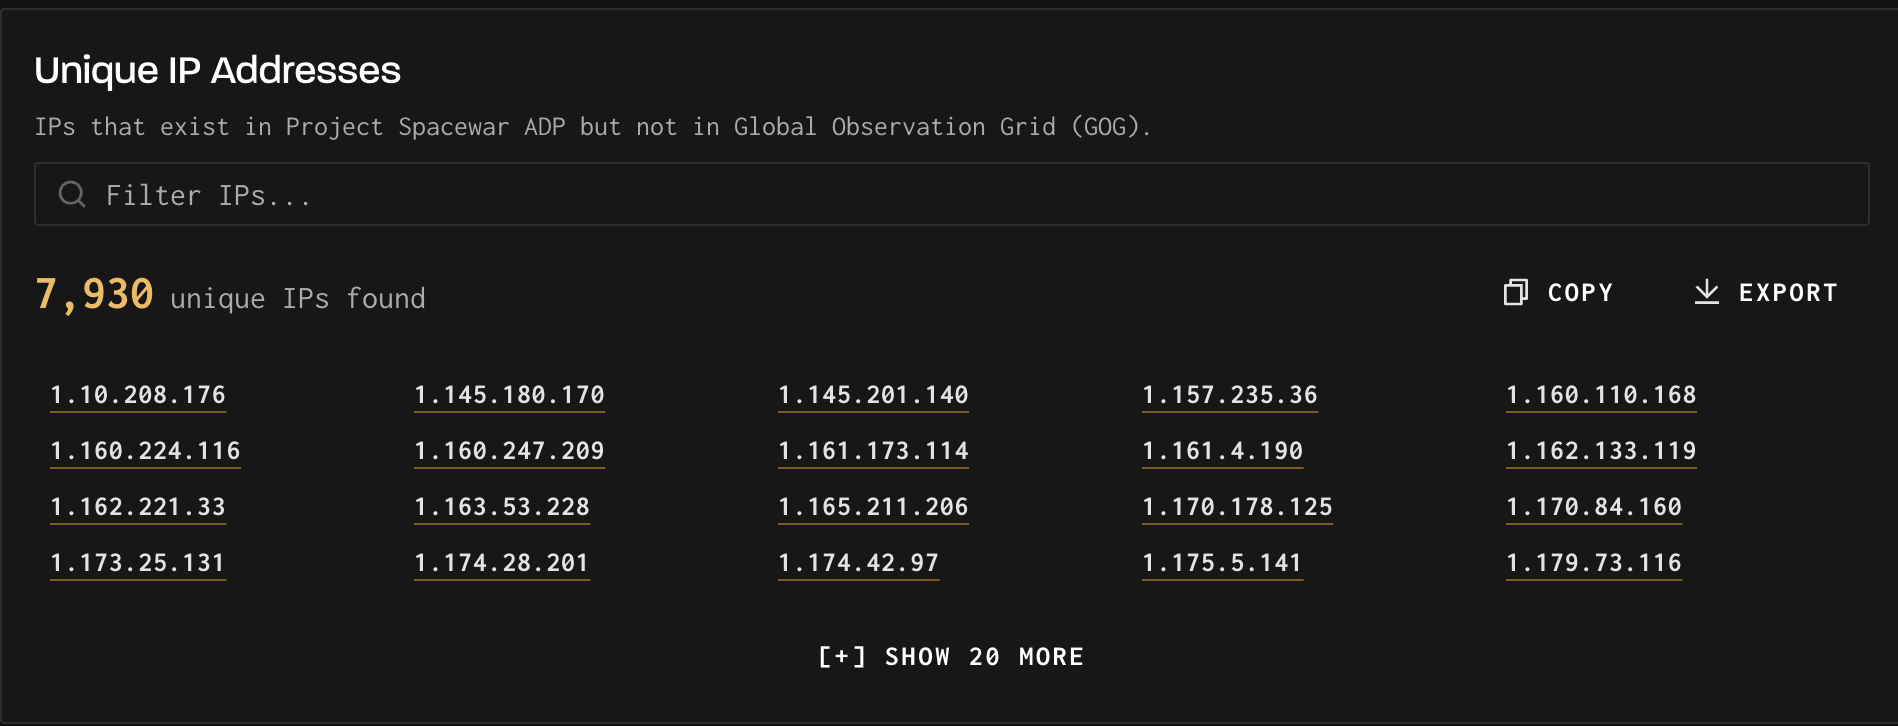
Unique IP Addresses
Below the distribution chart, the Unique IP Addresses section lists the specific IPs that exist in your workspace but not in the comparison workspace. You can filter this list using the search box above it.
To work with this list:
- Use Copy to copy all unique IPs to your clipboard\
- Use Export to download a CSV file containing the complete list of unique IPs (the full dataset, not just the first 1,000 shown on screen)
- Click [+] Show 20 More to page through additional results in the UI
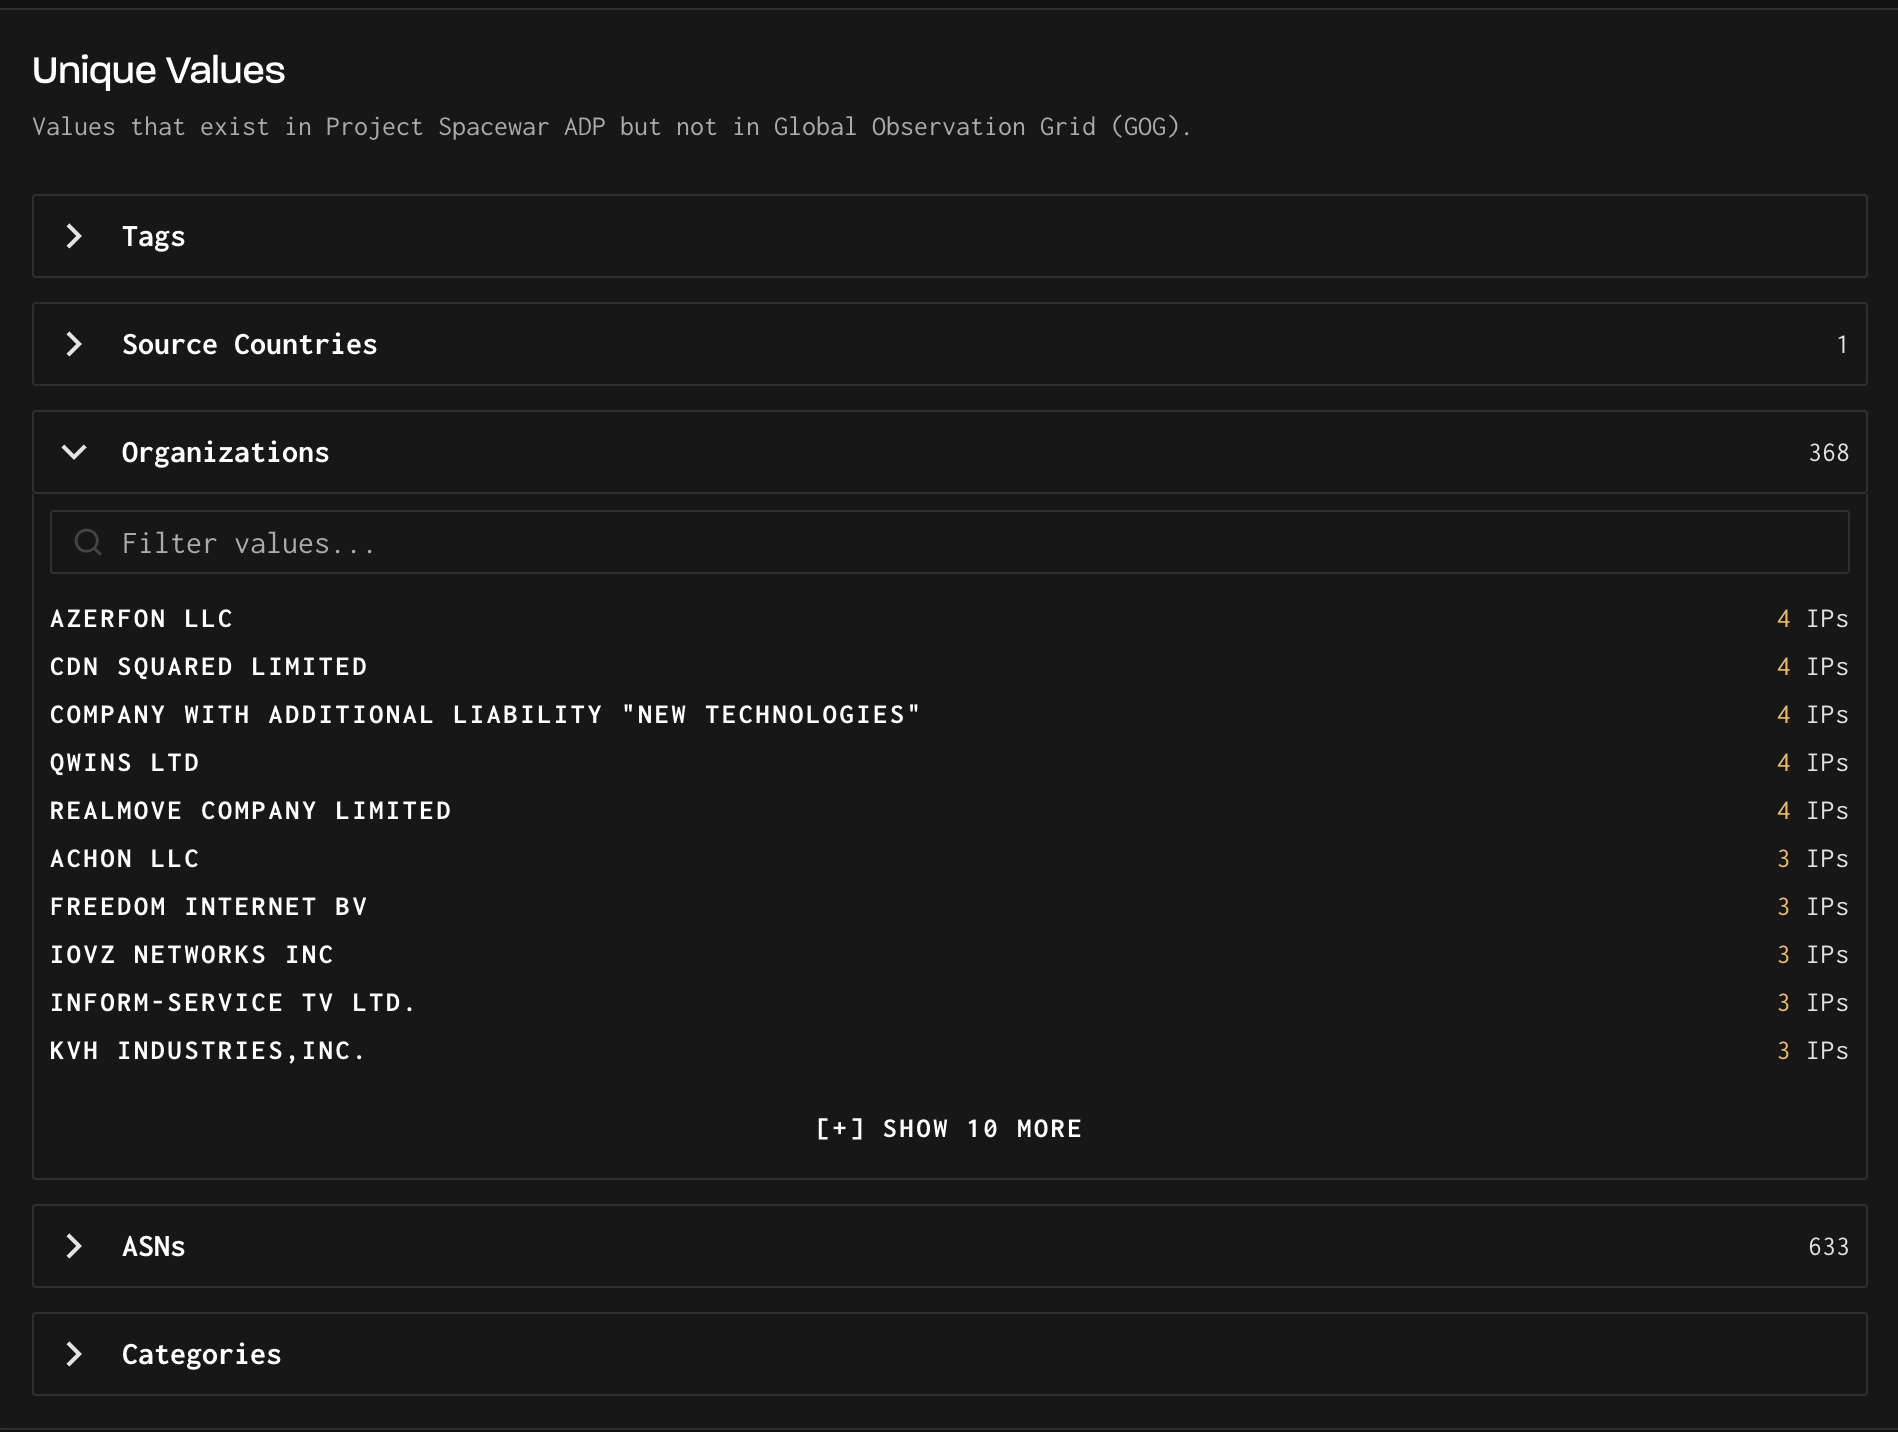
Unique Values
Below the Unique IPs list, Unique Values shows which Tags, Source Countries, Organizations, ASNs, and Categories appear in your workspace but not in the comparison workspace. Expand each section by clicking the chevron arrow. Each section shows how many unique values exist and lists them with the number of associated IPs.
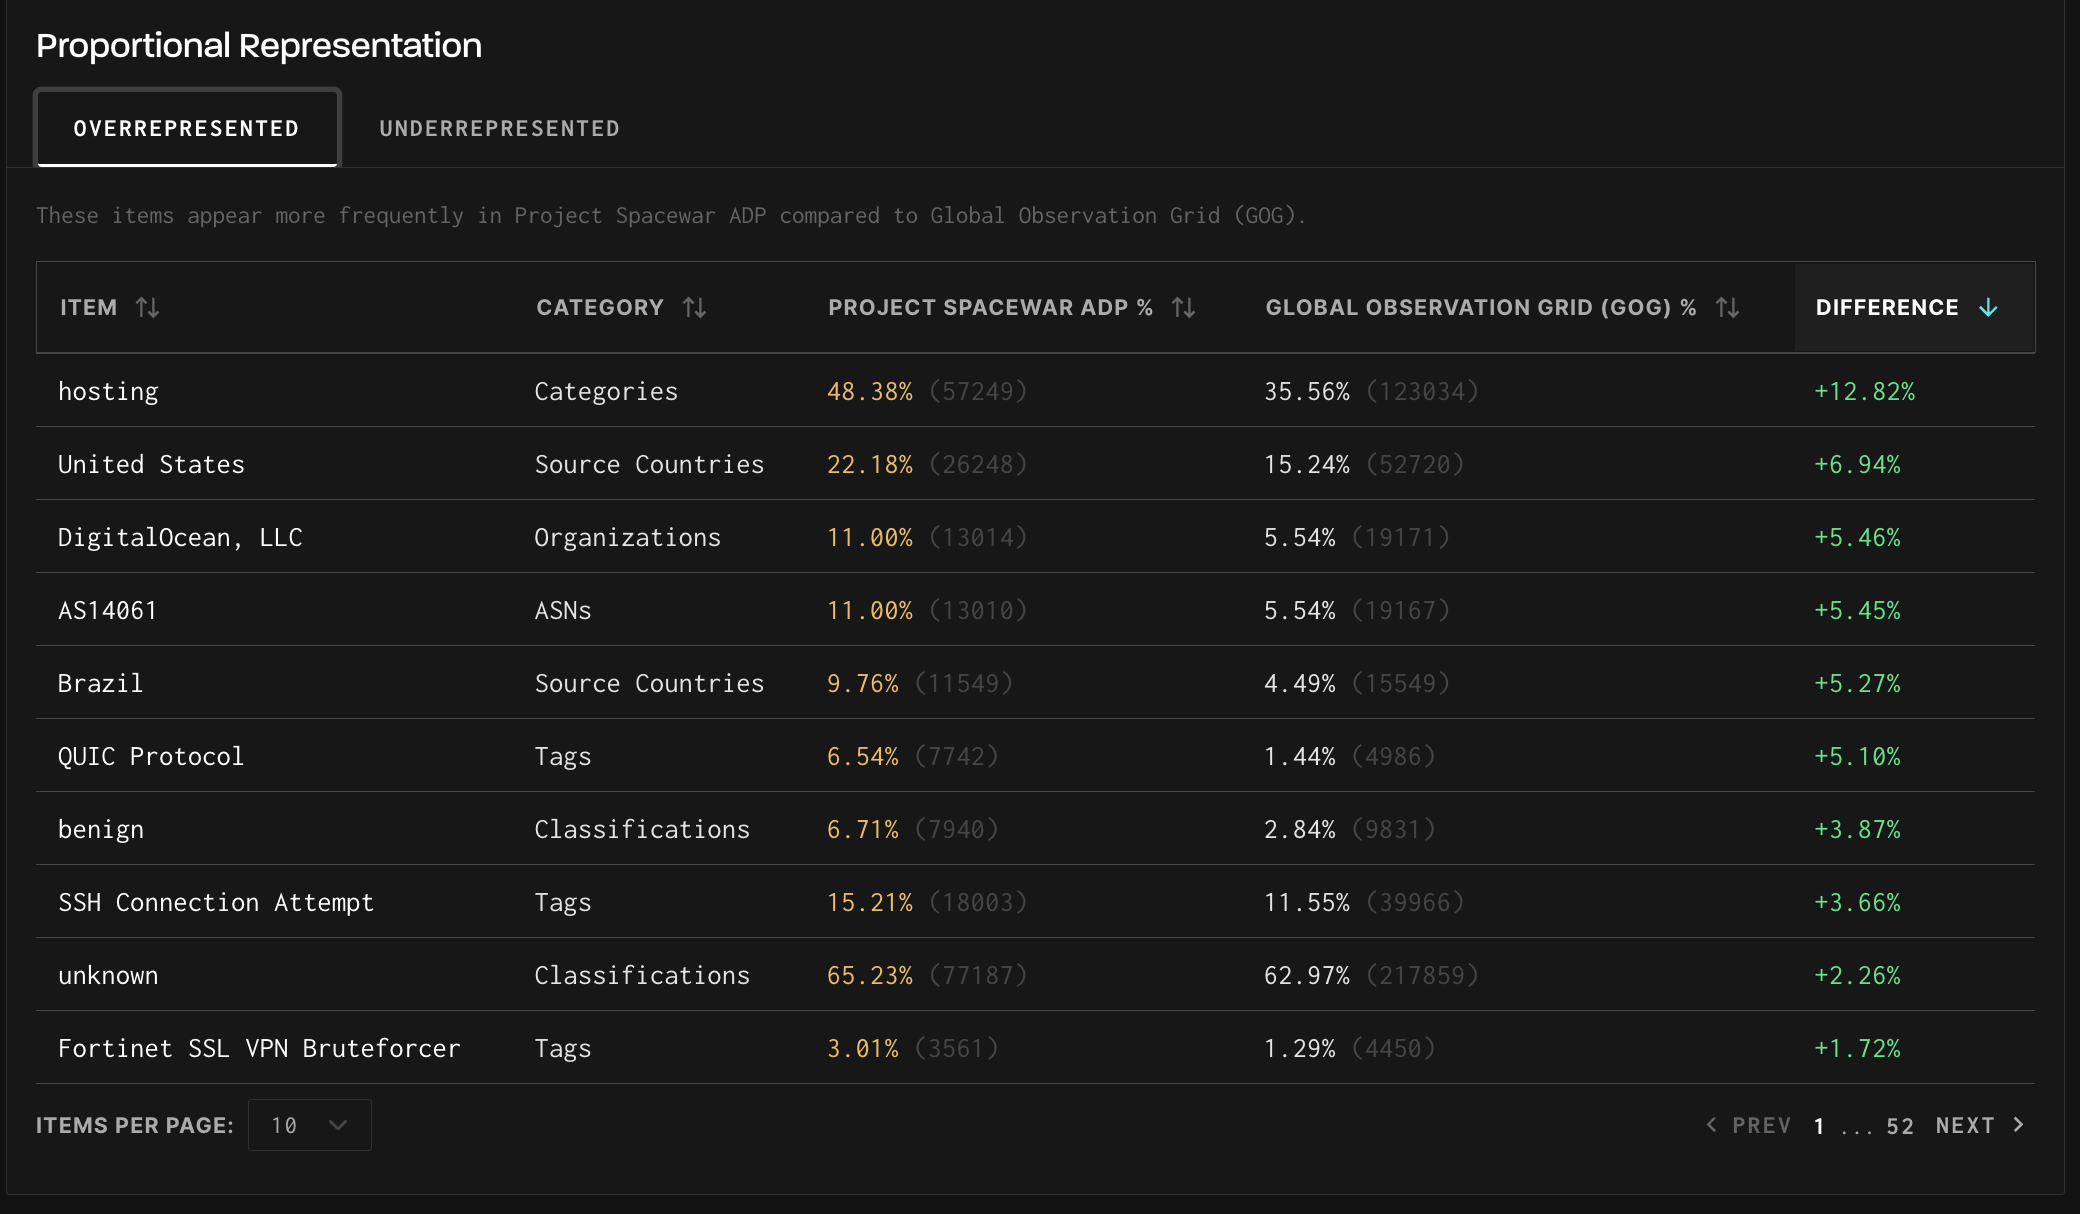
Proportional Representation
The Proportional Representation section at the bottom of the page has two tabs:
- Overrepresented shows items that appear at a higher percentage in your workspace than in the comparison workspace. Each row includes the item name, category, your workspace percentage and raw count, the GOG percentage and raw count, and the difference. Items at the top have the largest delta — meaning your sensors are seeing proportionally much more of this activity than the global grid.
- Underrepresented shows items that appear less frequently in your workspace compared to GOG. Small differences (e.g., -0.01%) are normal and typically not significant.
Exporting Your Data
To export the full list of unique IPs:
- Scroll to the Unique IP Addresses section
- Click the Export button in the upper right of that section
- A CSV file will download containing all unique IPs (not just the first 1,000 displayed)
Updated 4 months ago