
Tag Trends - Trending
Tag Trends - Trending
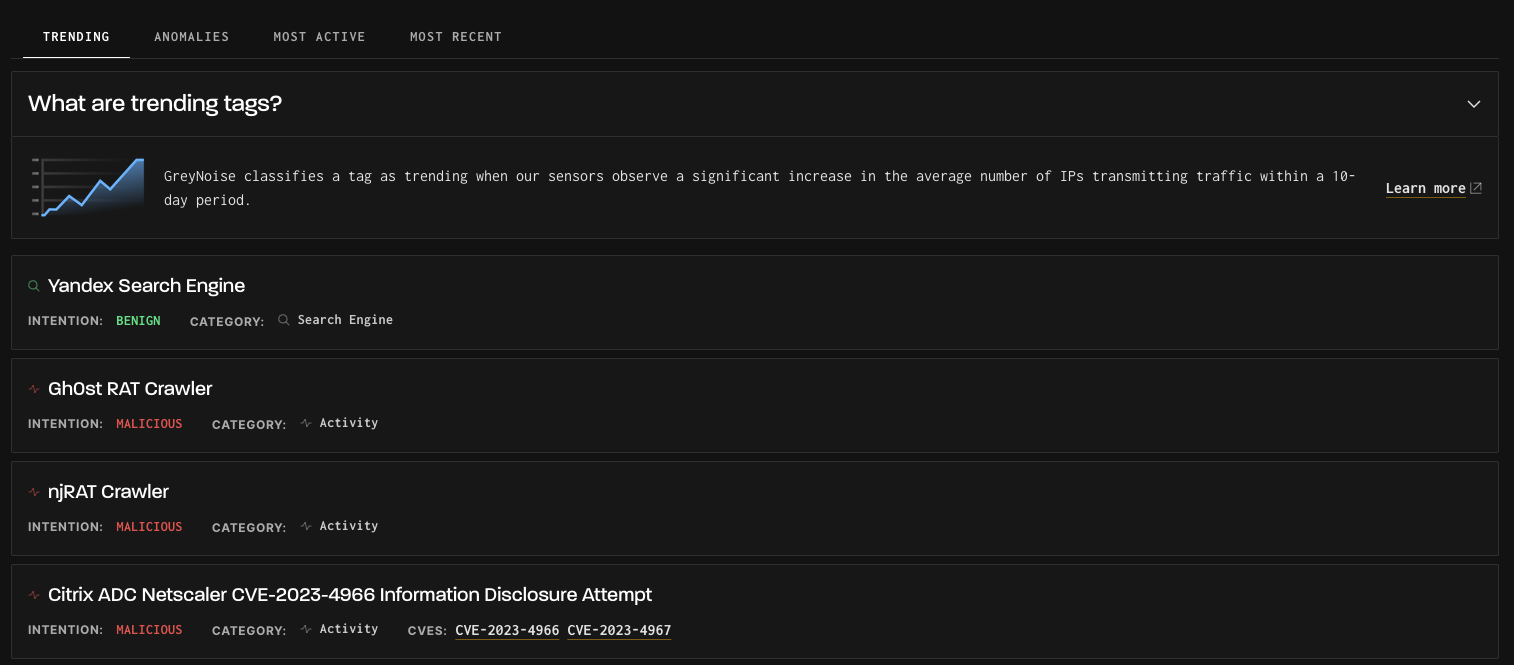
What are trending tags? - GreyNoise classifies a tag as trending when our sensors observe a significant increase in the average number of IPs transmitting traffic within a 10-day period. The list is sorted in descending order of the Percent Change value and displays the top ten tags.
Each tag card in the list contains:
- Tag Name
- Tag Category
- Tag Intent (Benign, Unknown, or Malicious)
- Associated CVEs
How Trending Detection Works
Detecting trends and anomalies is about finding deviation from previous behavior, particularly in a positive direction. Both tasks start with finding the average over a long period, at least ten days. The Trends tab looks at slower increases in traffic for a specific tag, comparing the long-term average to a short-term, more recent average, and doing the classic percent-change formula, thus:
(recent avg. - long term avg.)/long term avg. = % change
This produces a value we can use to rank which tags are seeing the most significant increase in average traffic. Below is an example of "trending" behavior.

Anomaly Detection
Perhaps a tag is not currently trending, but has it had spikes in traffic recently? That's what Anomaly detection and the Anomalies Tab looks for. This uses sliding windows of time over the last 30 days and compares that to an average view of the full 30 days. This detects large increases in a tag's activity anywhere in the last 30 days compared to its normal behavior.
What do I do with Trending Tags?
- Verify cybersecurity news or content about a rise in particular scanning or exploitation activity over the last three days.
- Potentially detect scanning that is not hyped yet.
- Verify a rising wave of activity on the internet at scale on new or old threats.
Updated 4 months ago