
Using the GreyNoise Visualizer
This Guide explains how to use the different features and components of the GreyNoise Visualizer.
Logging into the GreyNoise Visualizer
- Start at https://viz.greynoise.io
- Click on the "Login" option in the upper right corner navigation area and complete the login process
Searching for an IP
- Using the search bar in the middle of the Visualizer, enter an IP or CIDR block (ex. 59.98.196.0/24) to lookup

Searching for an IP or CIDR block from the Visualizer search bar
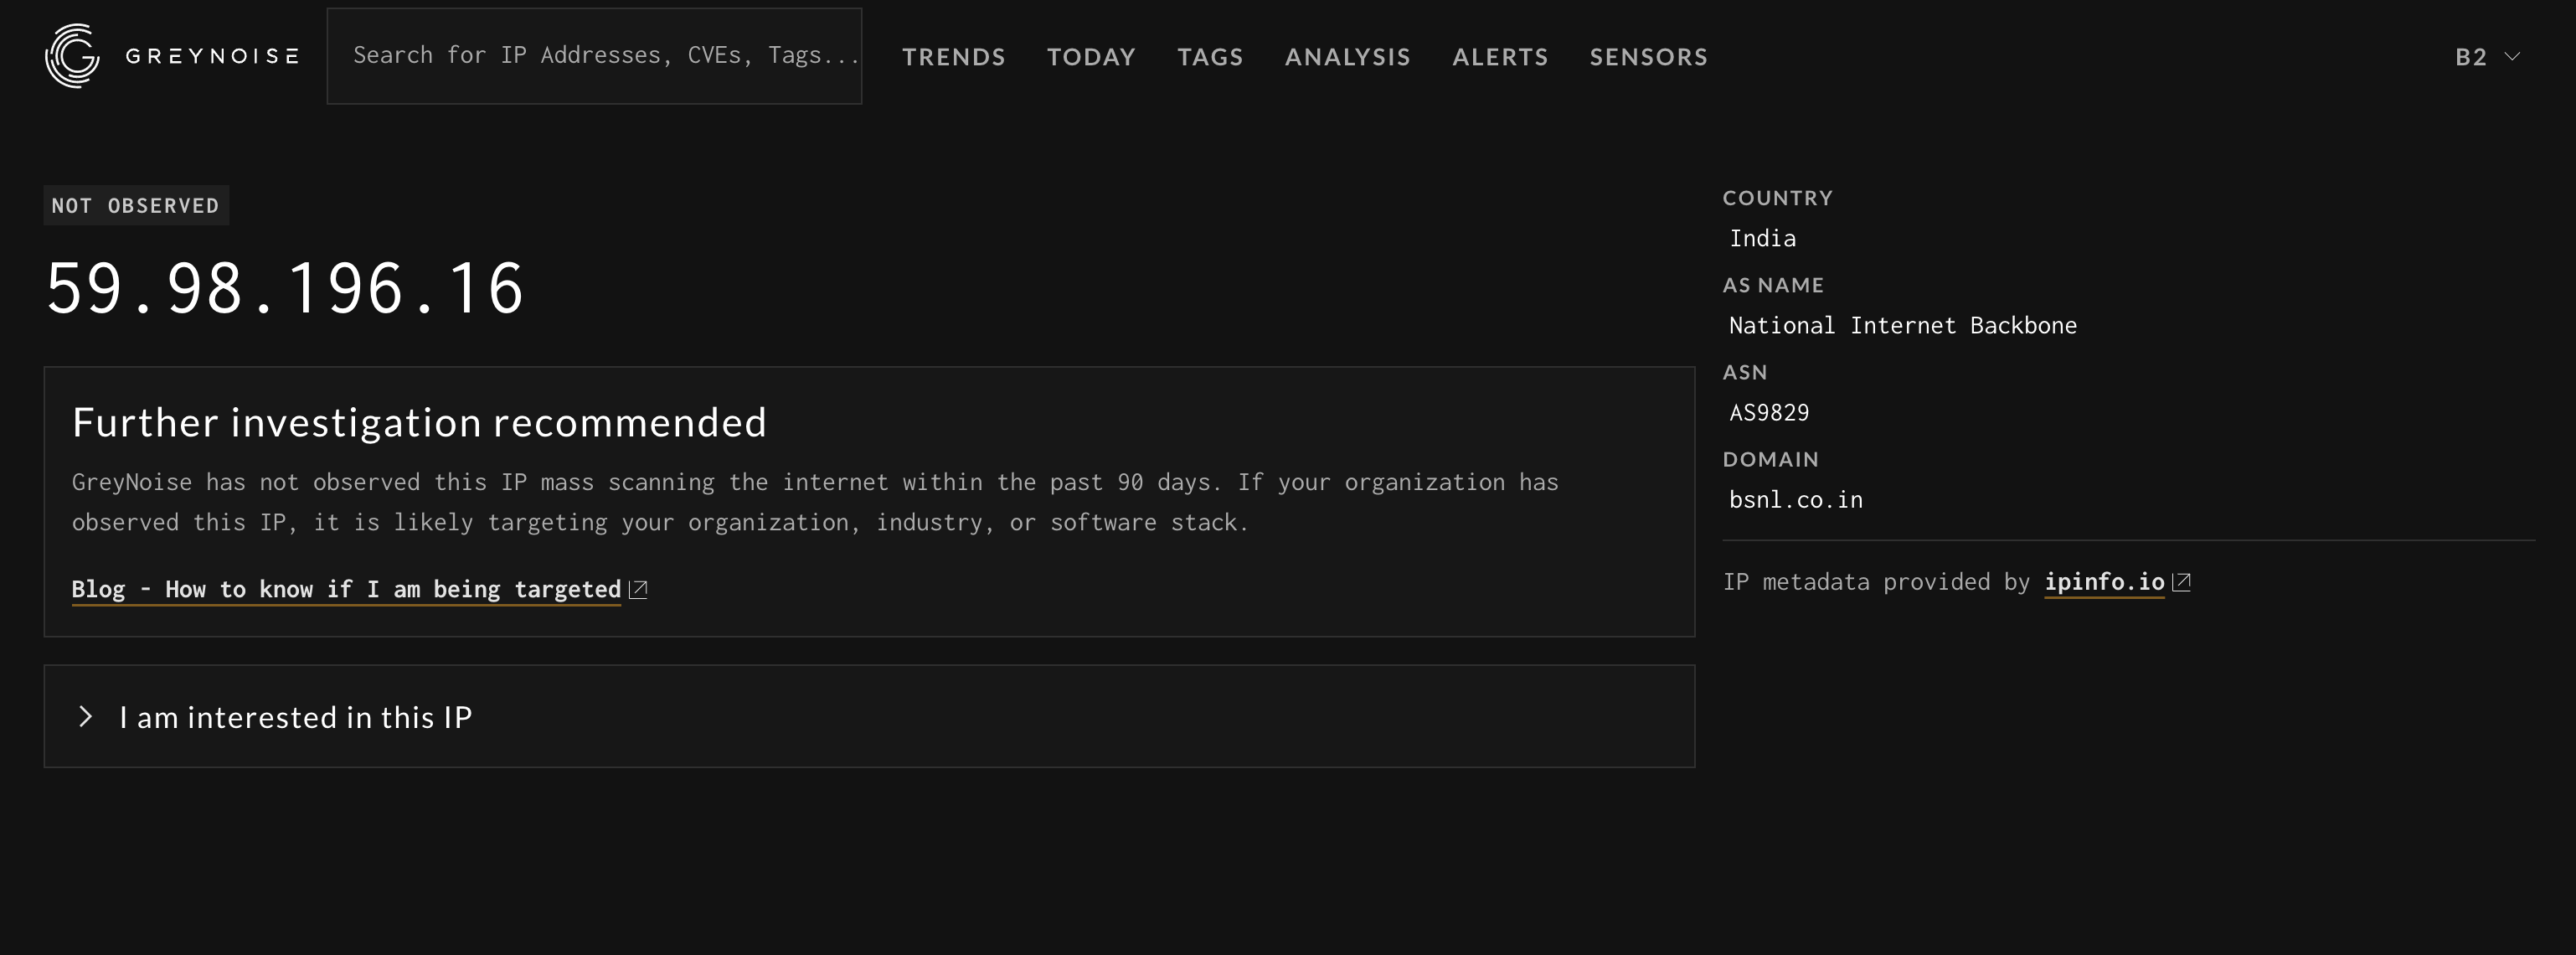
- From the search results, click on the View IP Details link to see the details of the IP
If the IP is not found, a basic IP details page with some IP Geo information will be displayed.
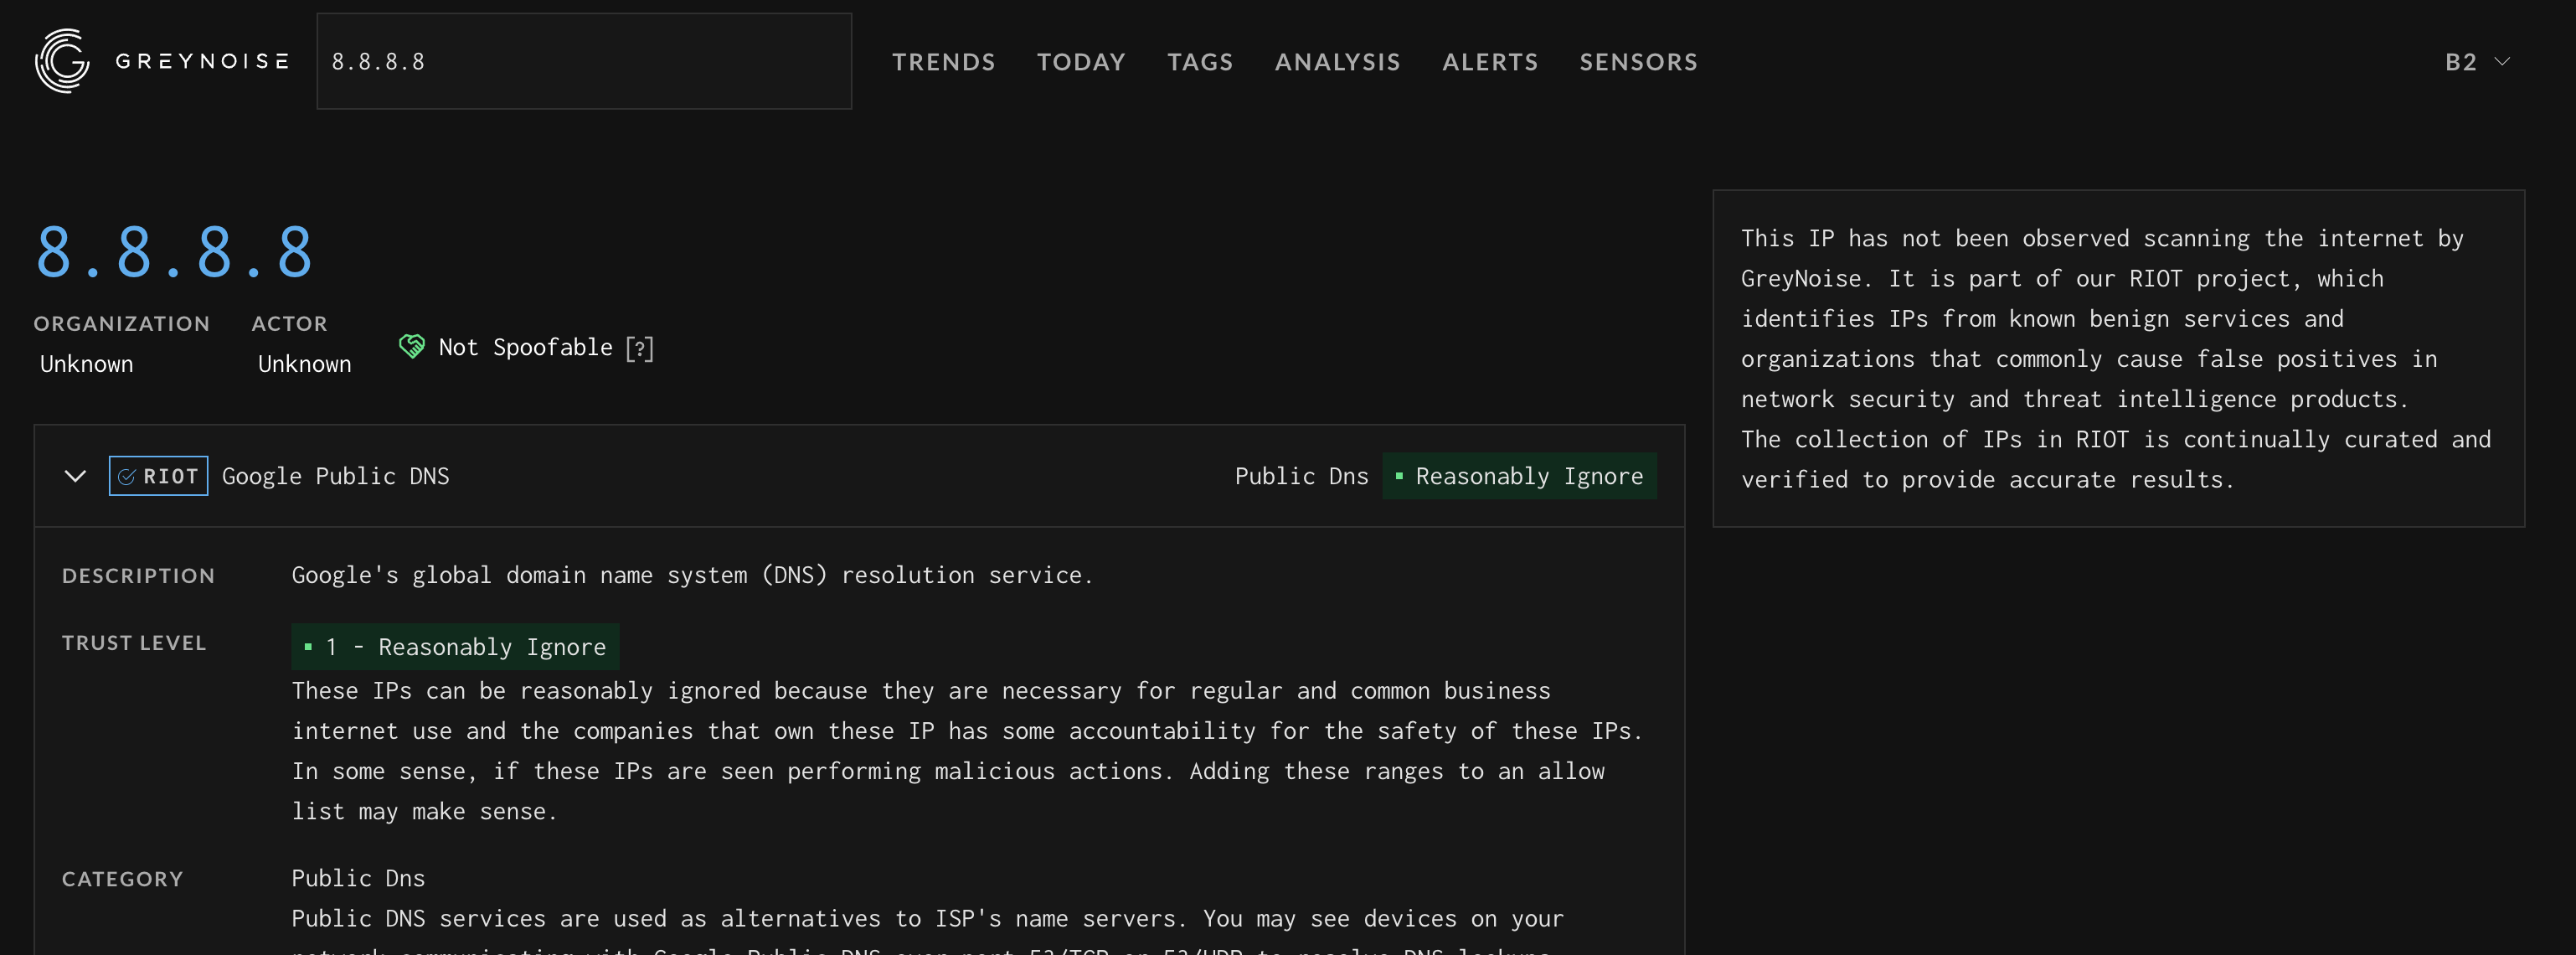
If the IP is part of the RIOT (common business services) dataset and the Visualizer will direct you to the RIOT page for the provided IP
Reviewing the details of an IP (Internet Scanner)
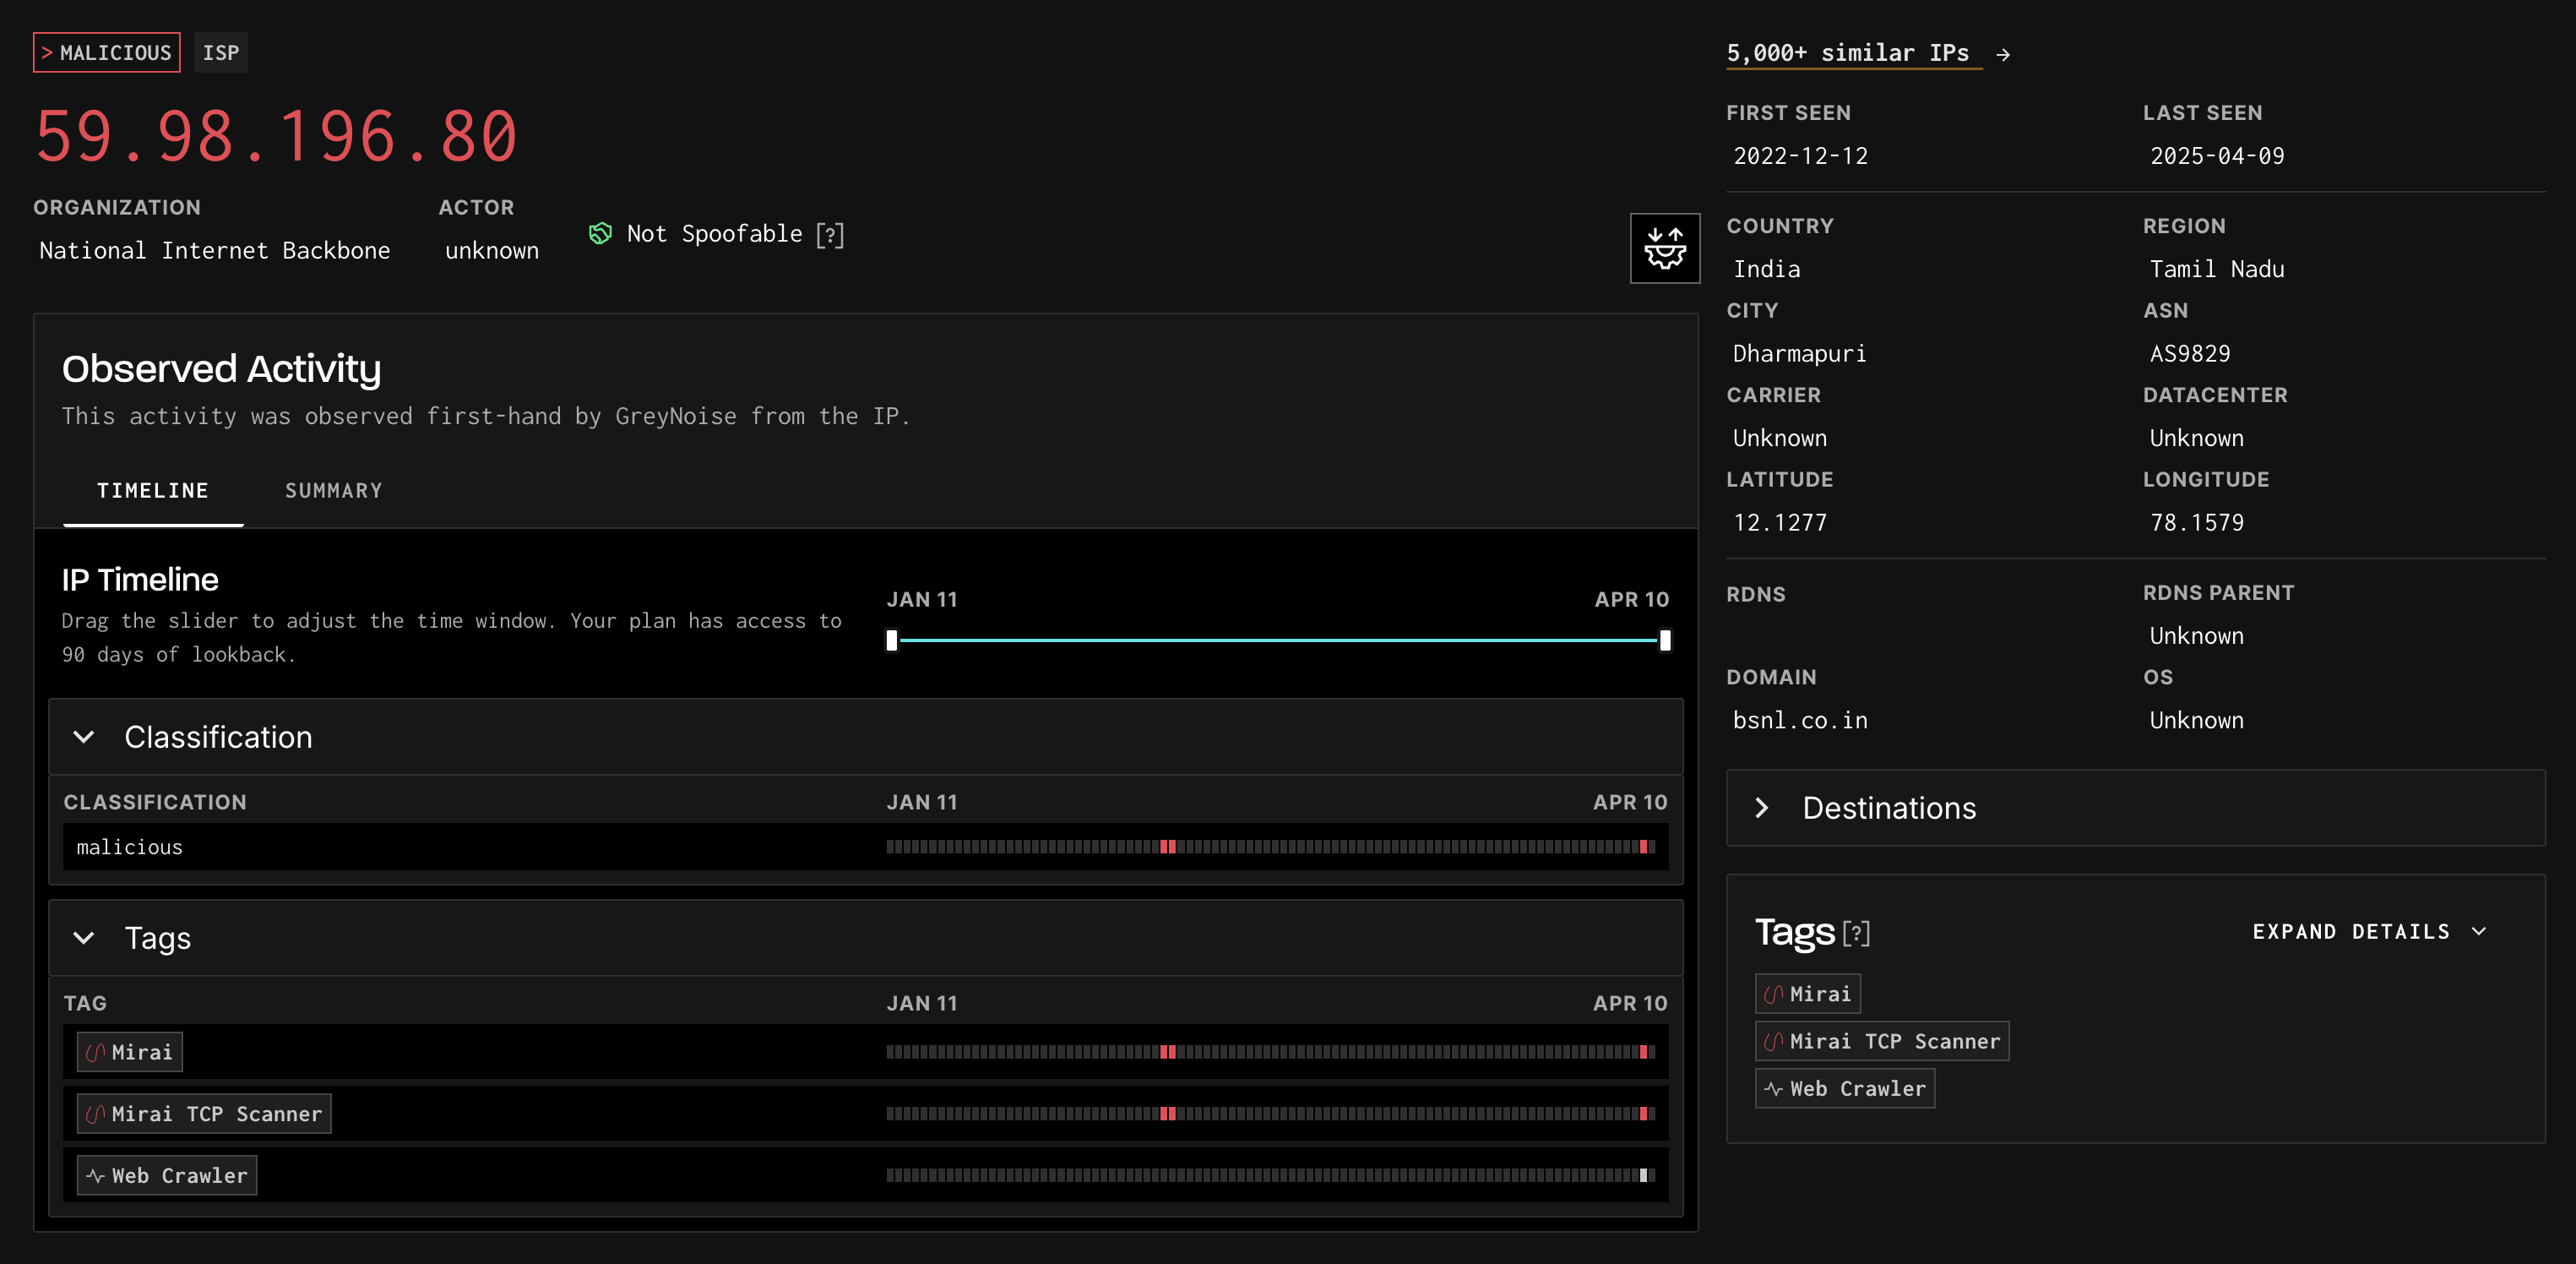
The Noise IP details page is broken down into the following sections:
- Metadata
- Tags
- Timeline
- Summary
The IP itself will display as:
- RED if classified as Malicious
- YELLOW if classified as Suspicious
- GREEN if classified as Benign
- GRAY if classified as Unknown
- PURPLE if part of a VPN or TOR network.
The organization and actor are also called out under the IP if known.
Additional data points may be displayed above the IP to provide additional information for analysis:
- Spoofable: The IP has failed to complete a full TCP connection
- VPN: The IP is associated with a VPN service (VPN Information is provided by Spur). The Service Name is also provided
The metadata section includes:
- First Seen: The first date GreyNoise observed this IP scanning
- Last Seen: The last date GreyNoise observed this IP scanning
- OS: The operating system the IP scanner is running
- ASN: The ASN the IP belongs to
- Location Data: Region, Country, and City are provided when known
- rDNS: The Reverse DNS entry for the IP, if known
When available, the Summary section of the page displays captured Port, Path, User-Agent, JA3s, and Fingerprints observed with this IP
Tags are used to help classify an IP and also to provide additional context data to an analyst. A list of tags is displayed under the metadata section, but details on the tags are also displayed along the bottom right sidebar of the page. Tags are colored RED when the intention is malicious, GREEN when the intention is benign, and GRAY when the intention is unknown. A full list of tags can be seen via the Cheat Sheet page: https://viz.greynoise.io/tags
CVEs associated with certain tags are also displayed on the bottom right sidebar of the page, directly above the tag details list.
A benign IP address may have tags that are indicated as malicious intent. These are benign based on the Actor being a known good actor.
Reviewing the Details of an IP (Common Business Services)
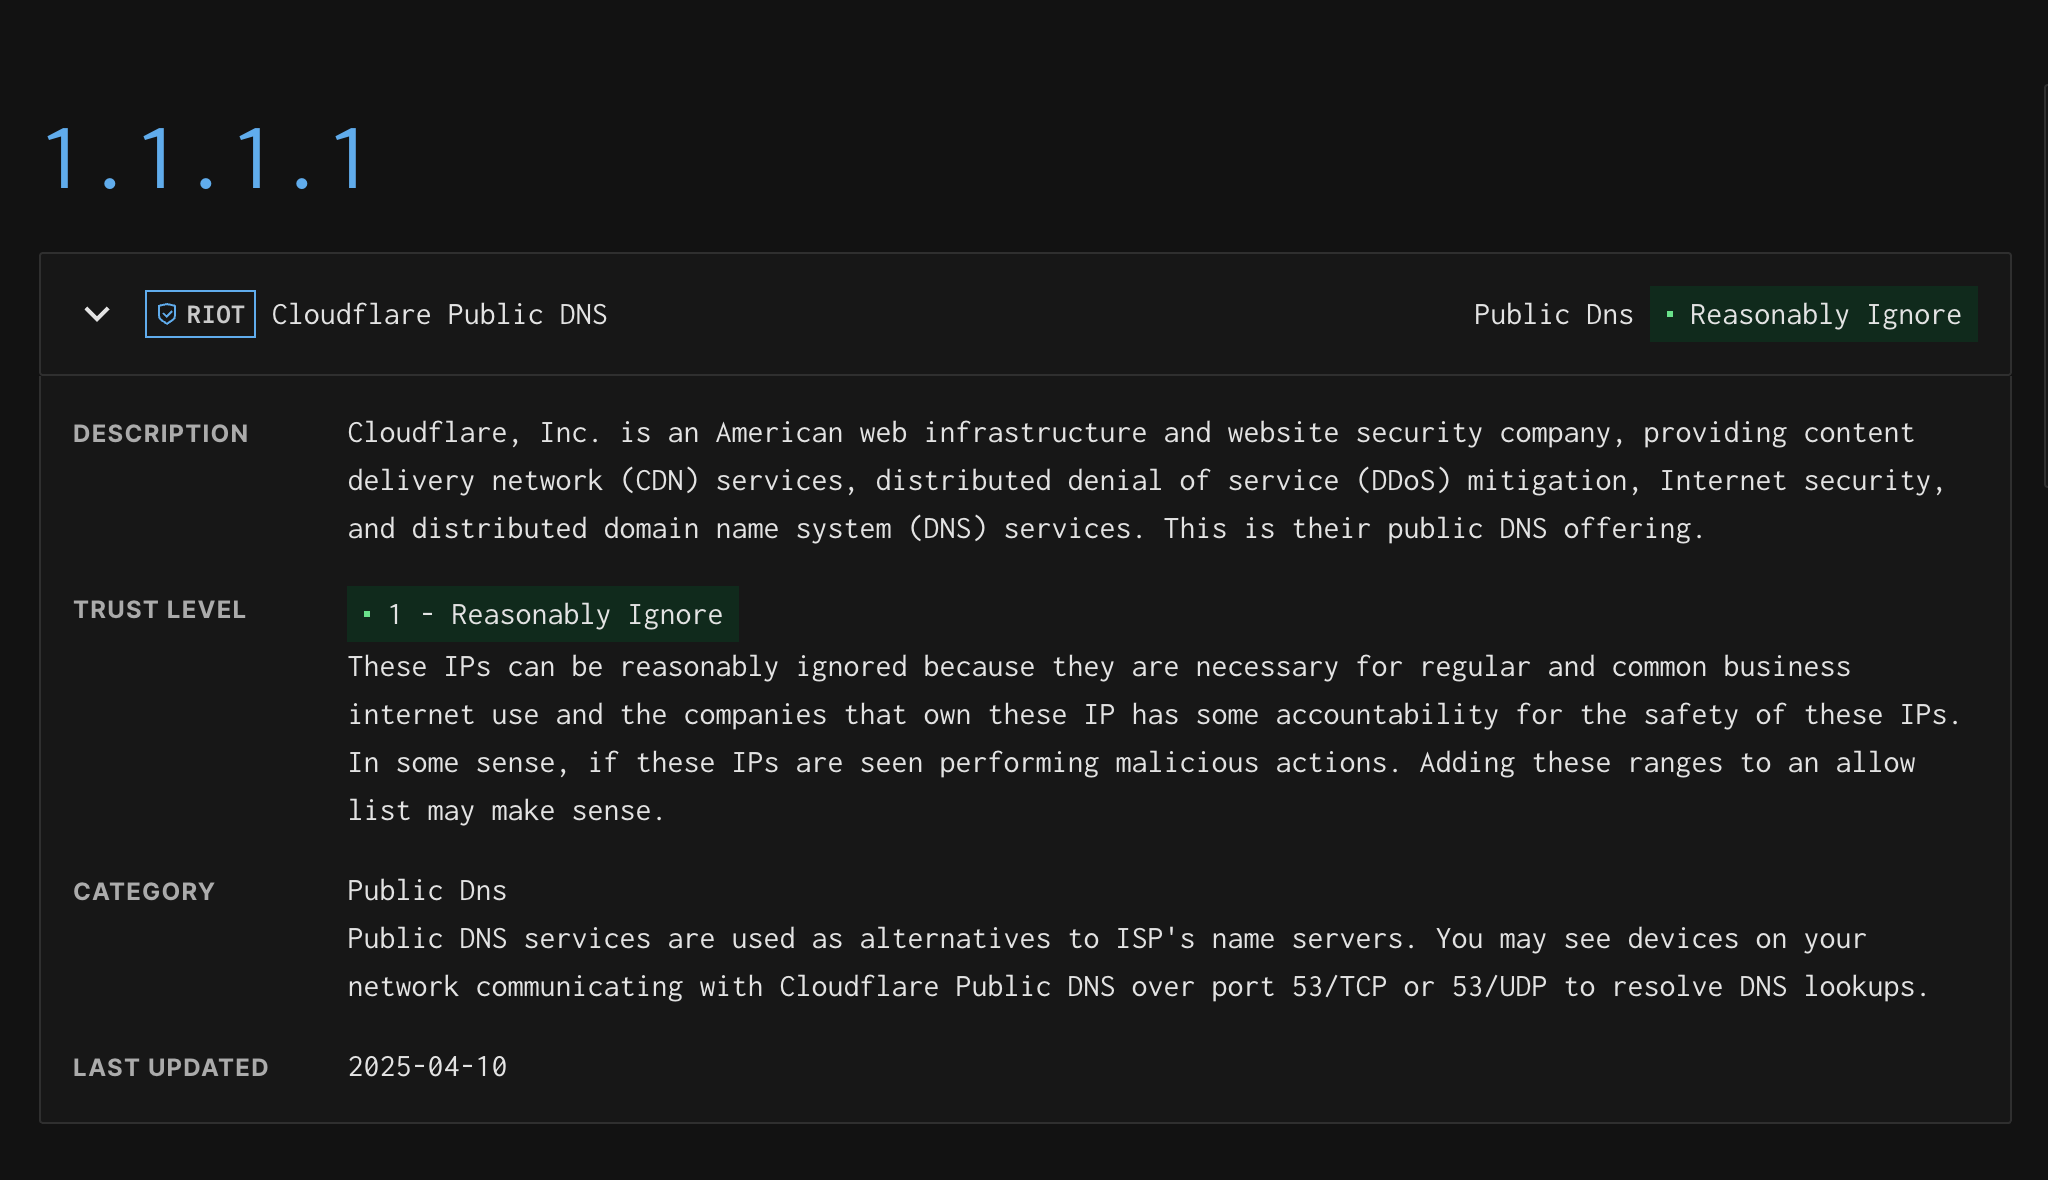
The IP details page for an IP found in the Common Business Service dataset displays the following:
- Service Name/Provider
- Service Category
- The Trust Level of the IP. Details Here.
- The last time this IP was updated in the dataset
Performing a GreyNoise Query (GNQL)
Using the Visualizer search bar, enter a GreyNoise Query using the GNQL (GreyNoise Query Language) syntax.
Here are some common examples:
classification:malicious last_seen:1d
metadata.organization:"Acme Inc"
metadata.asn:AS35313
tags:"ADB Attempt"
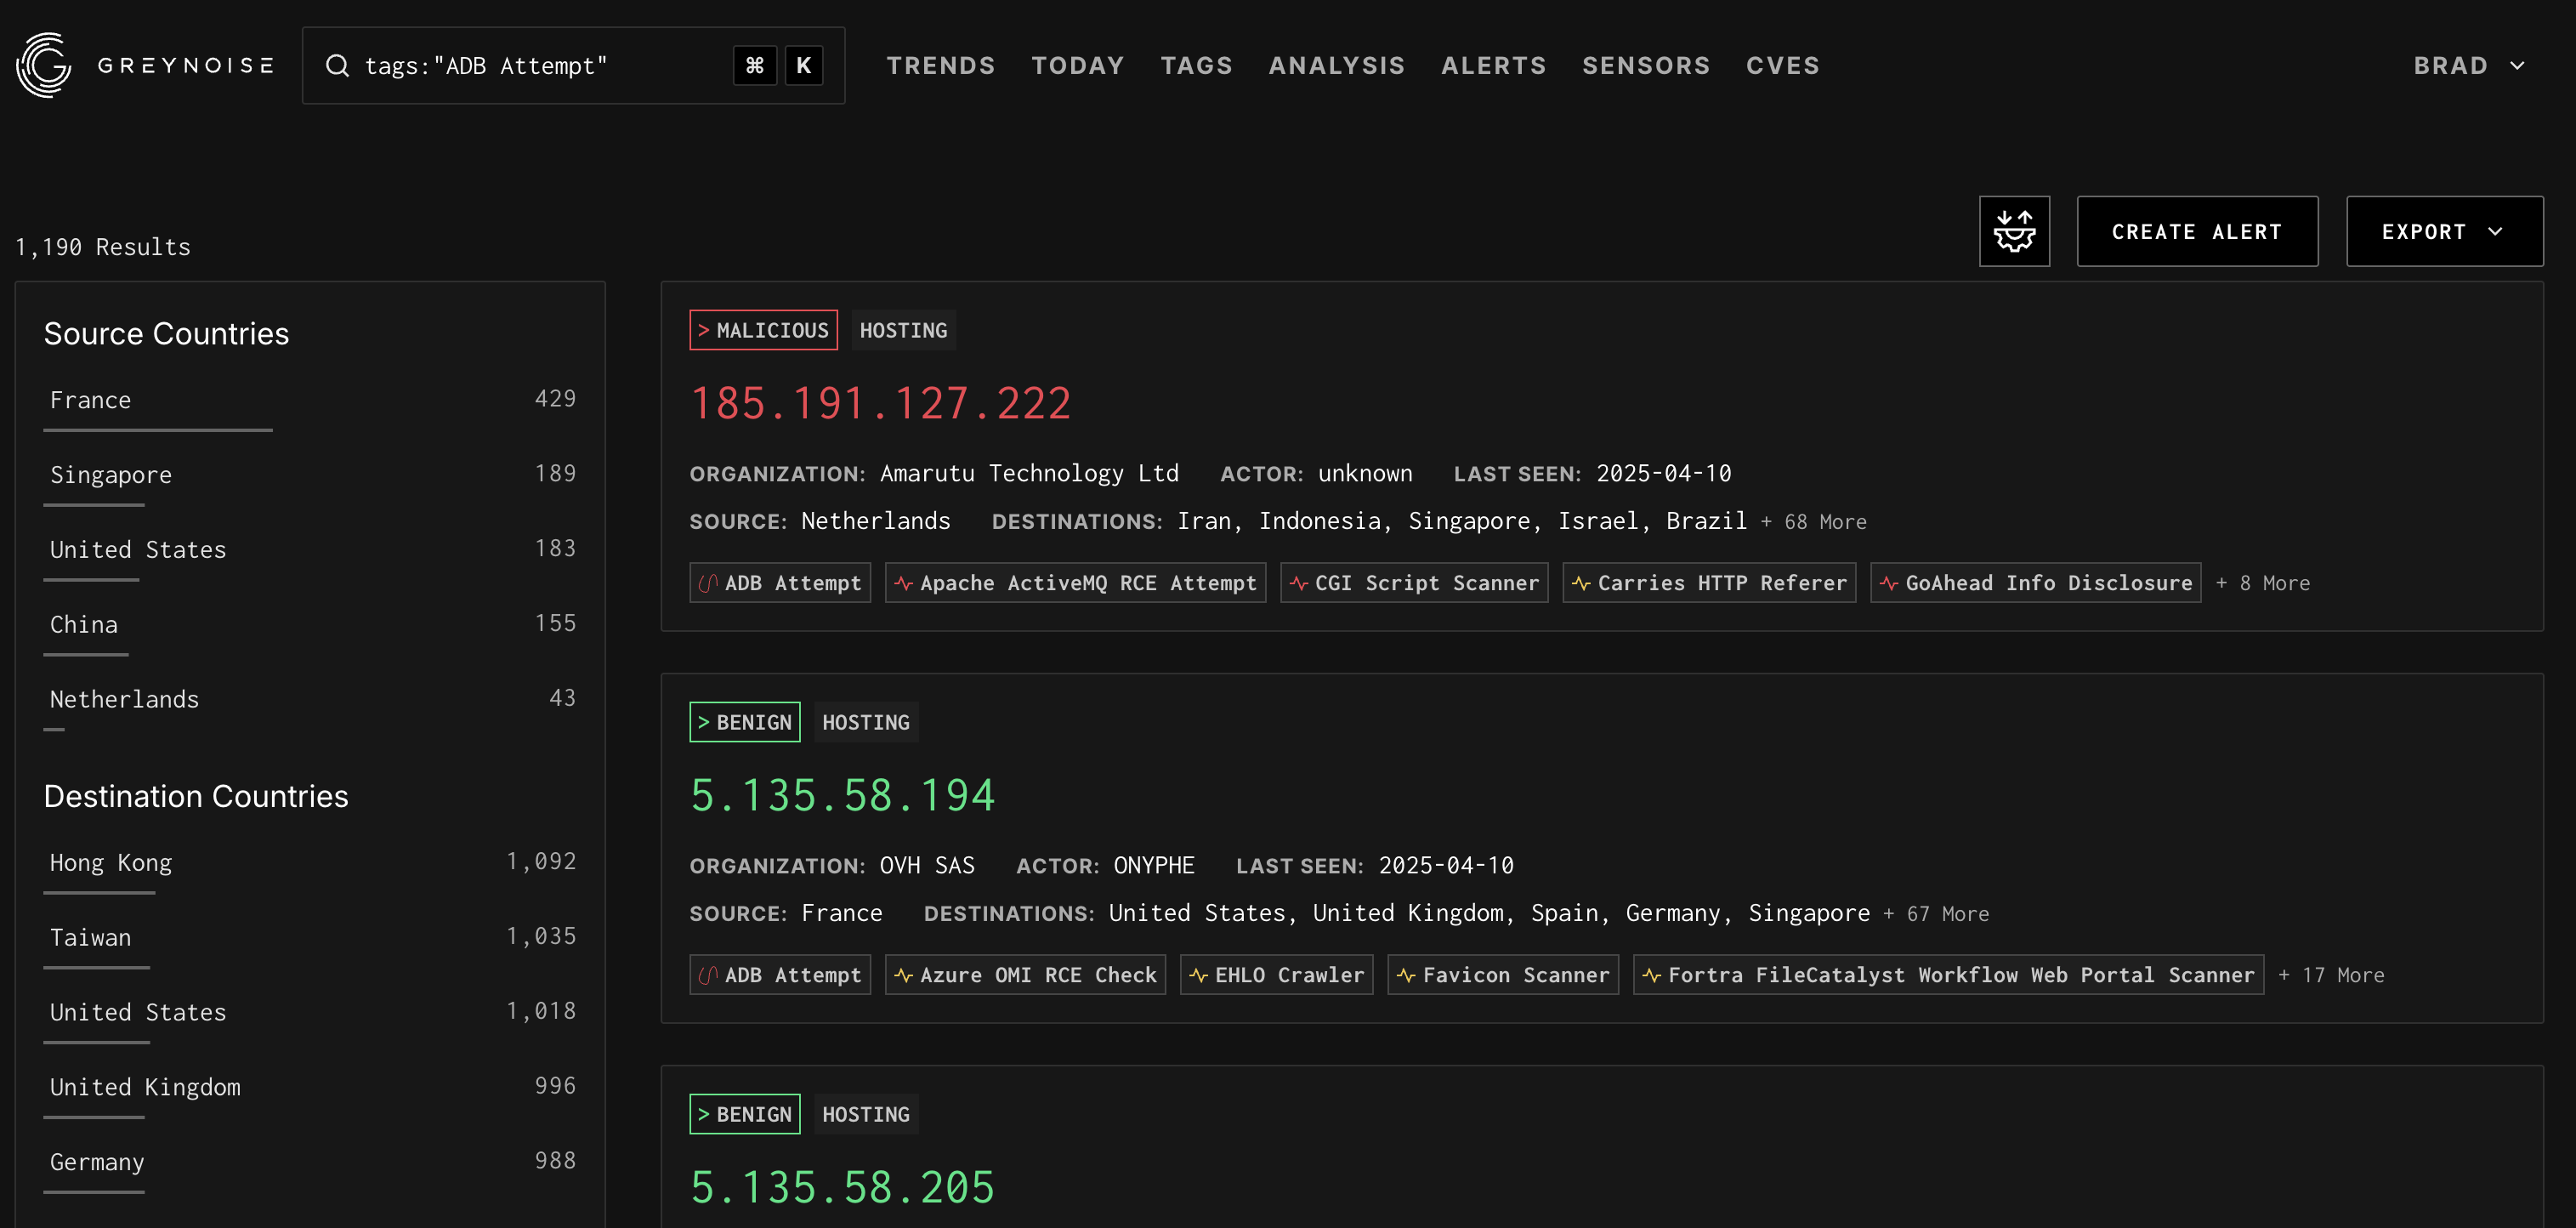
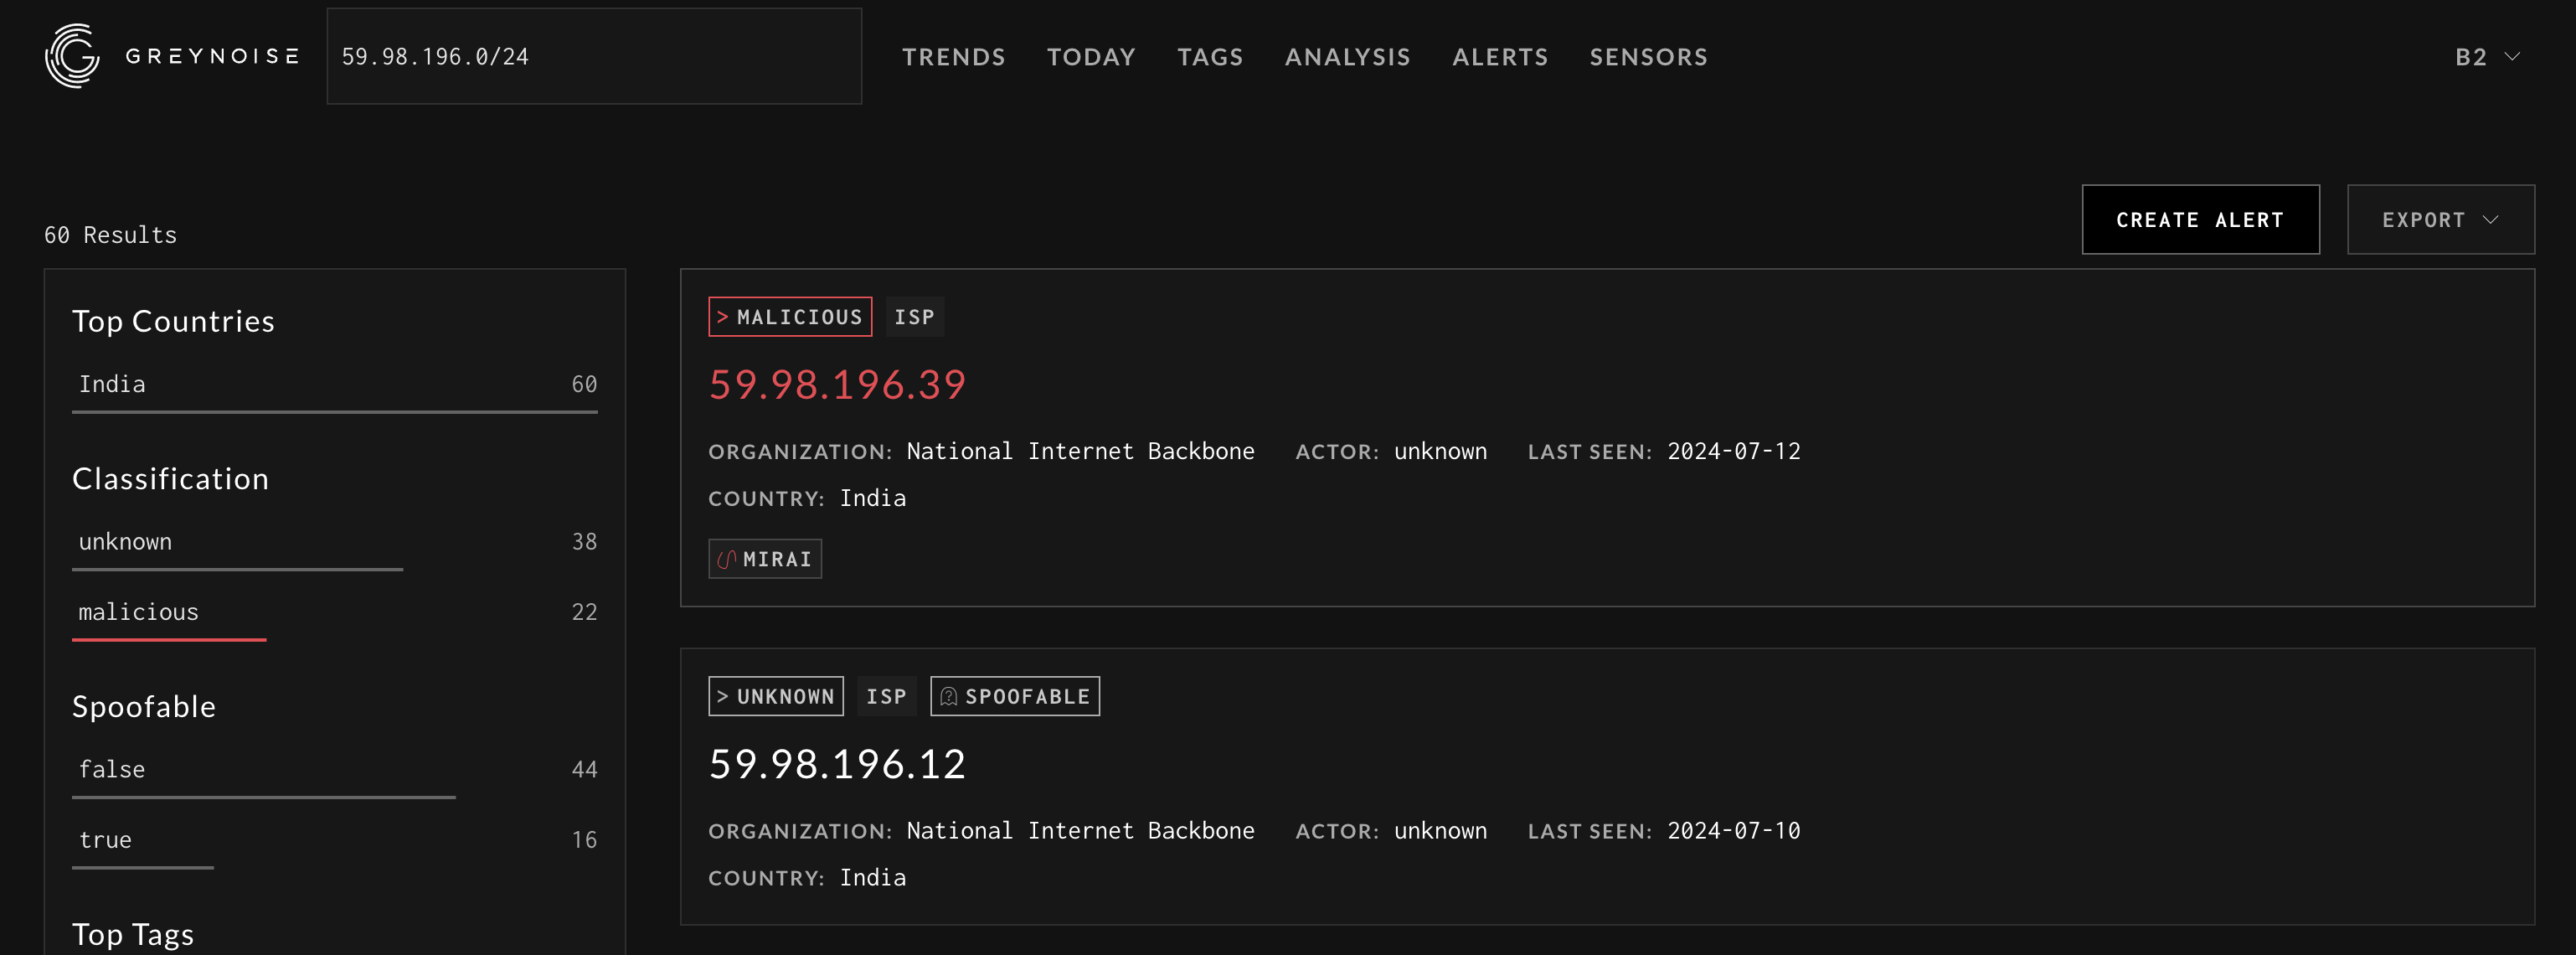
The search results page provides:
- Total Number of results for matching query
- The left sidebar provides breakdowns by Country, Classification, and other context
- A list of IP results sorted by last seen date
Each IP can be drilled into by clicking the View IP Details link on any IP card in the right-side result panel.
Customers with an active subscription can also Export the search results using the Export button at the top of the results list. Available Export options are JSON and CSV
Reference the GNQL docs for more information about queries
Viewing the Latest GreyNoise Trends
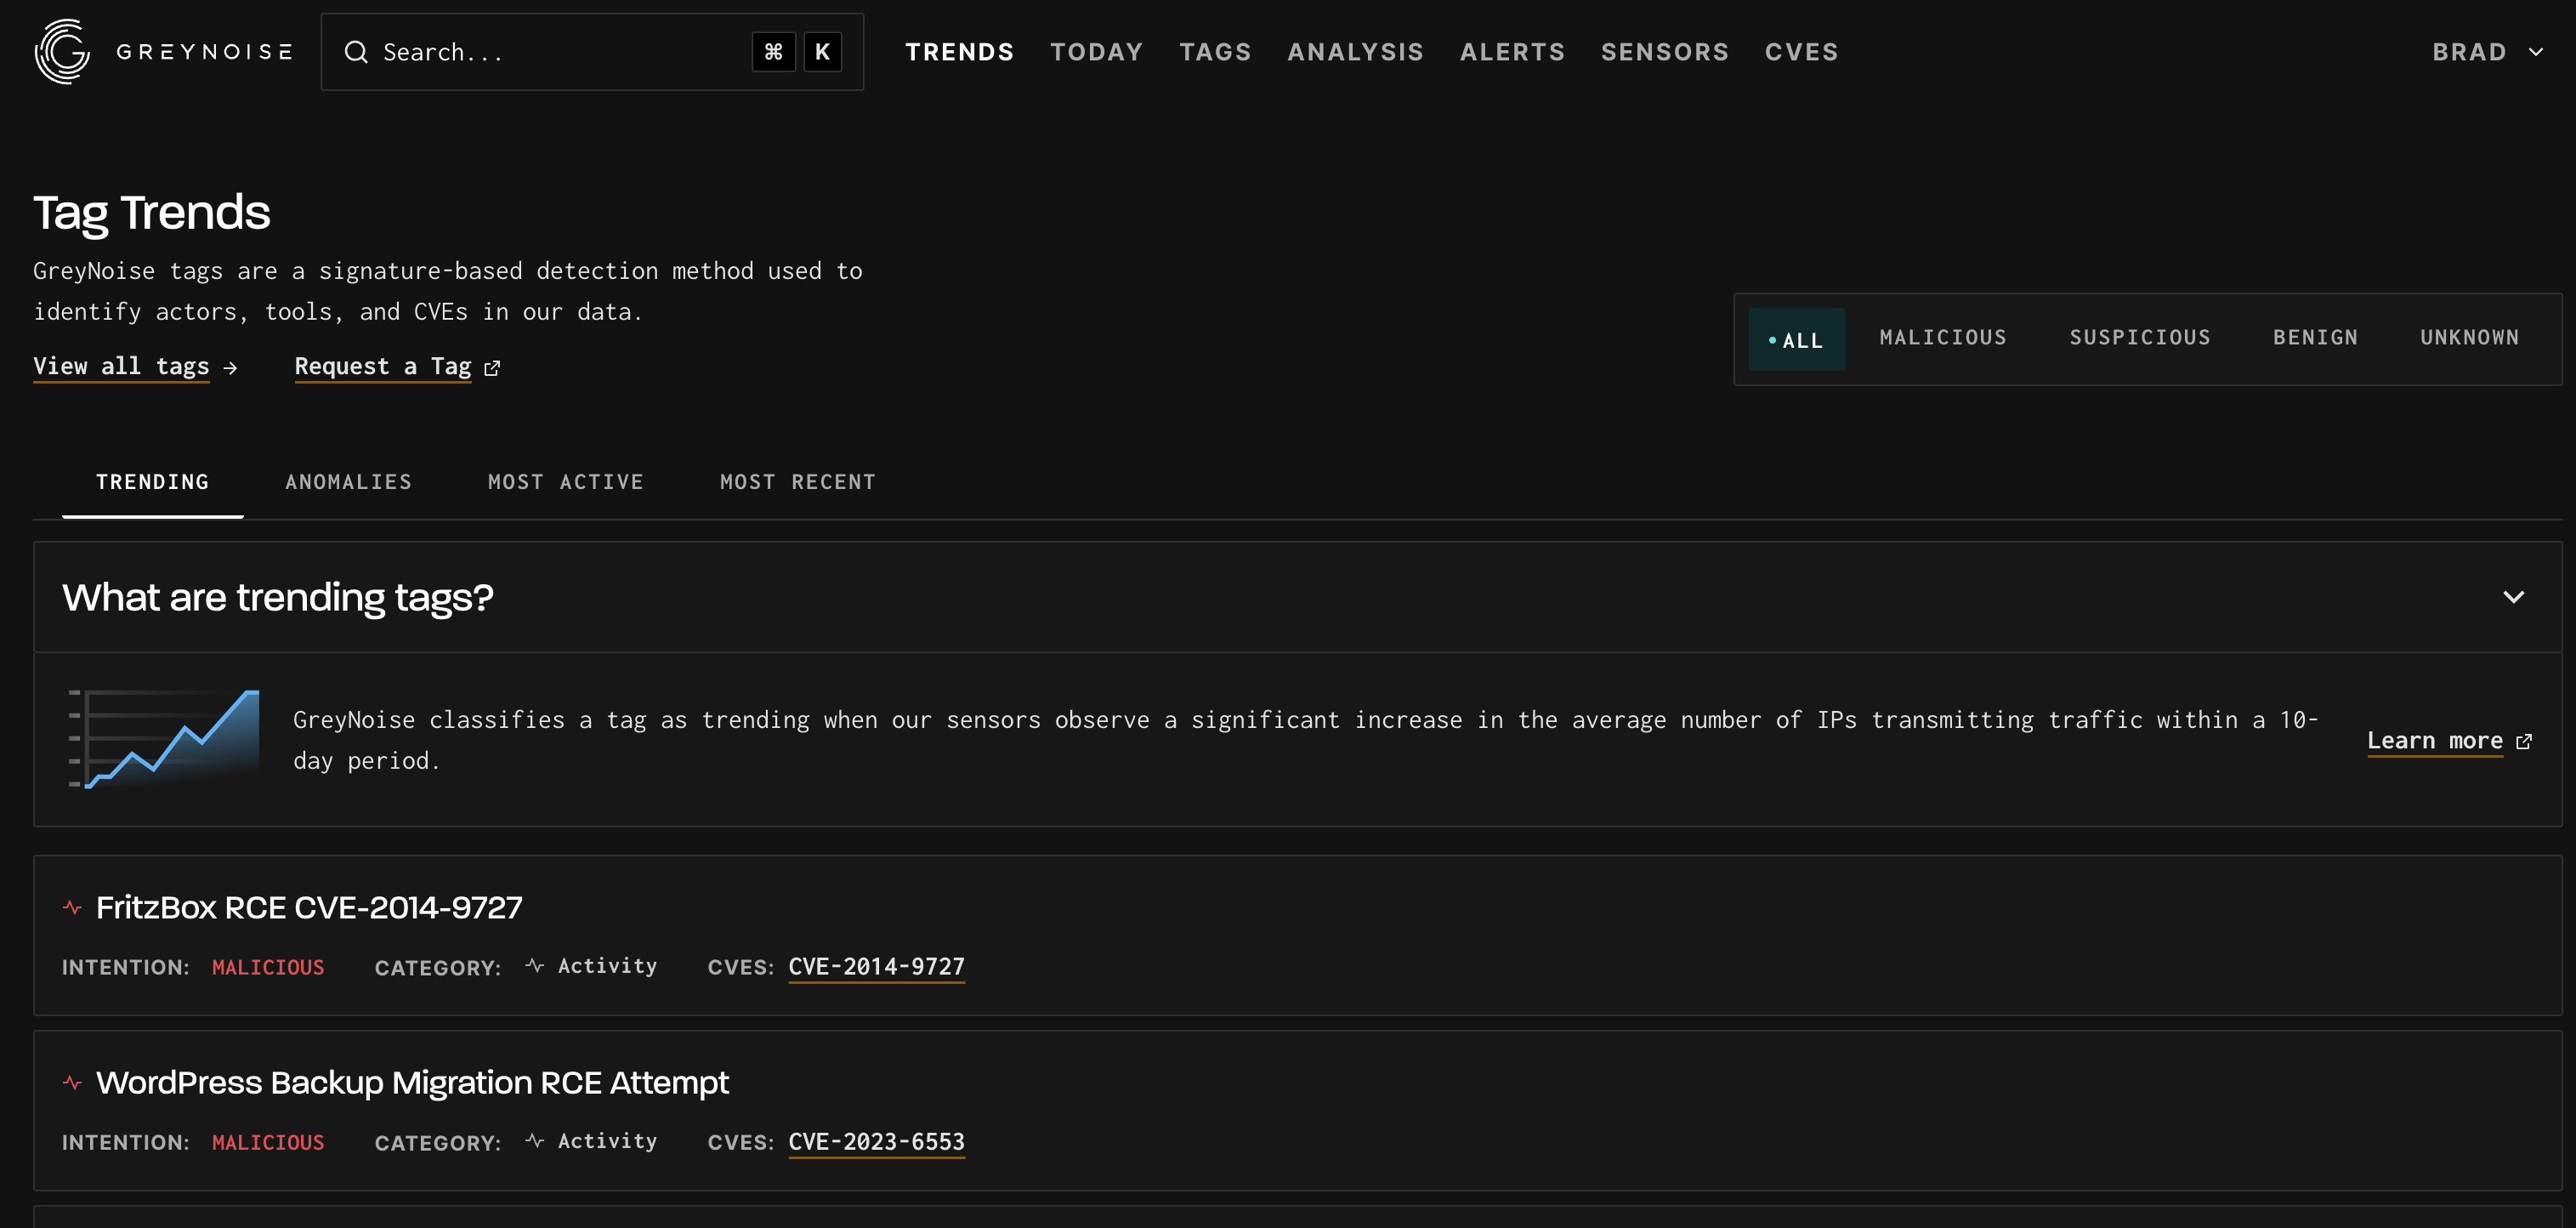
Start by Navigating to the Trends Page of the Visualizer: https://viz.greynoise.io/trends
The Tag Trends page provides insight into observed scanning trends occurring. Full details can be found here.
Analyzing a File or List of IPs
Start by Navigation to the Analysis page: https://viz.greynoise.io/analysis
The Analysis page can analyze a file or list of IPs and provide insight into the IPs submitted. The tool will parse IPv4 addresses from the file or input and provide an overview of the results.
To begin the analysis, enter a list of IPs or blob of text, or select a file such as an auth.log file and press the analyze button.
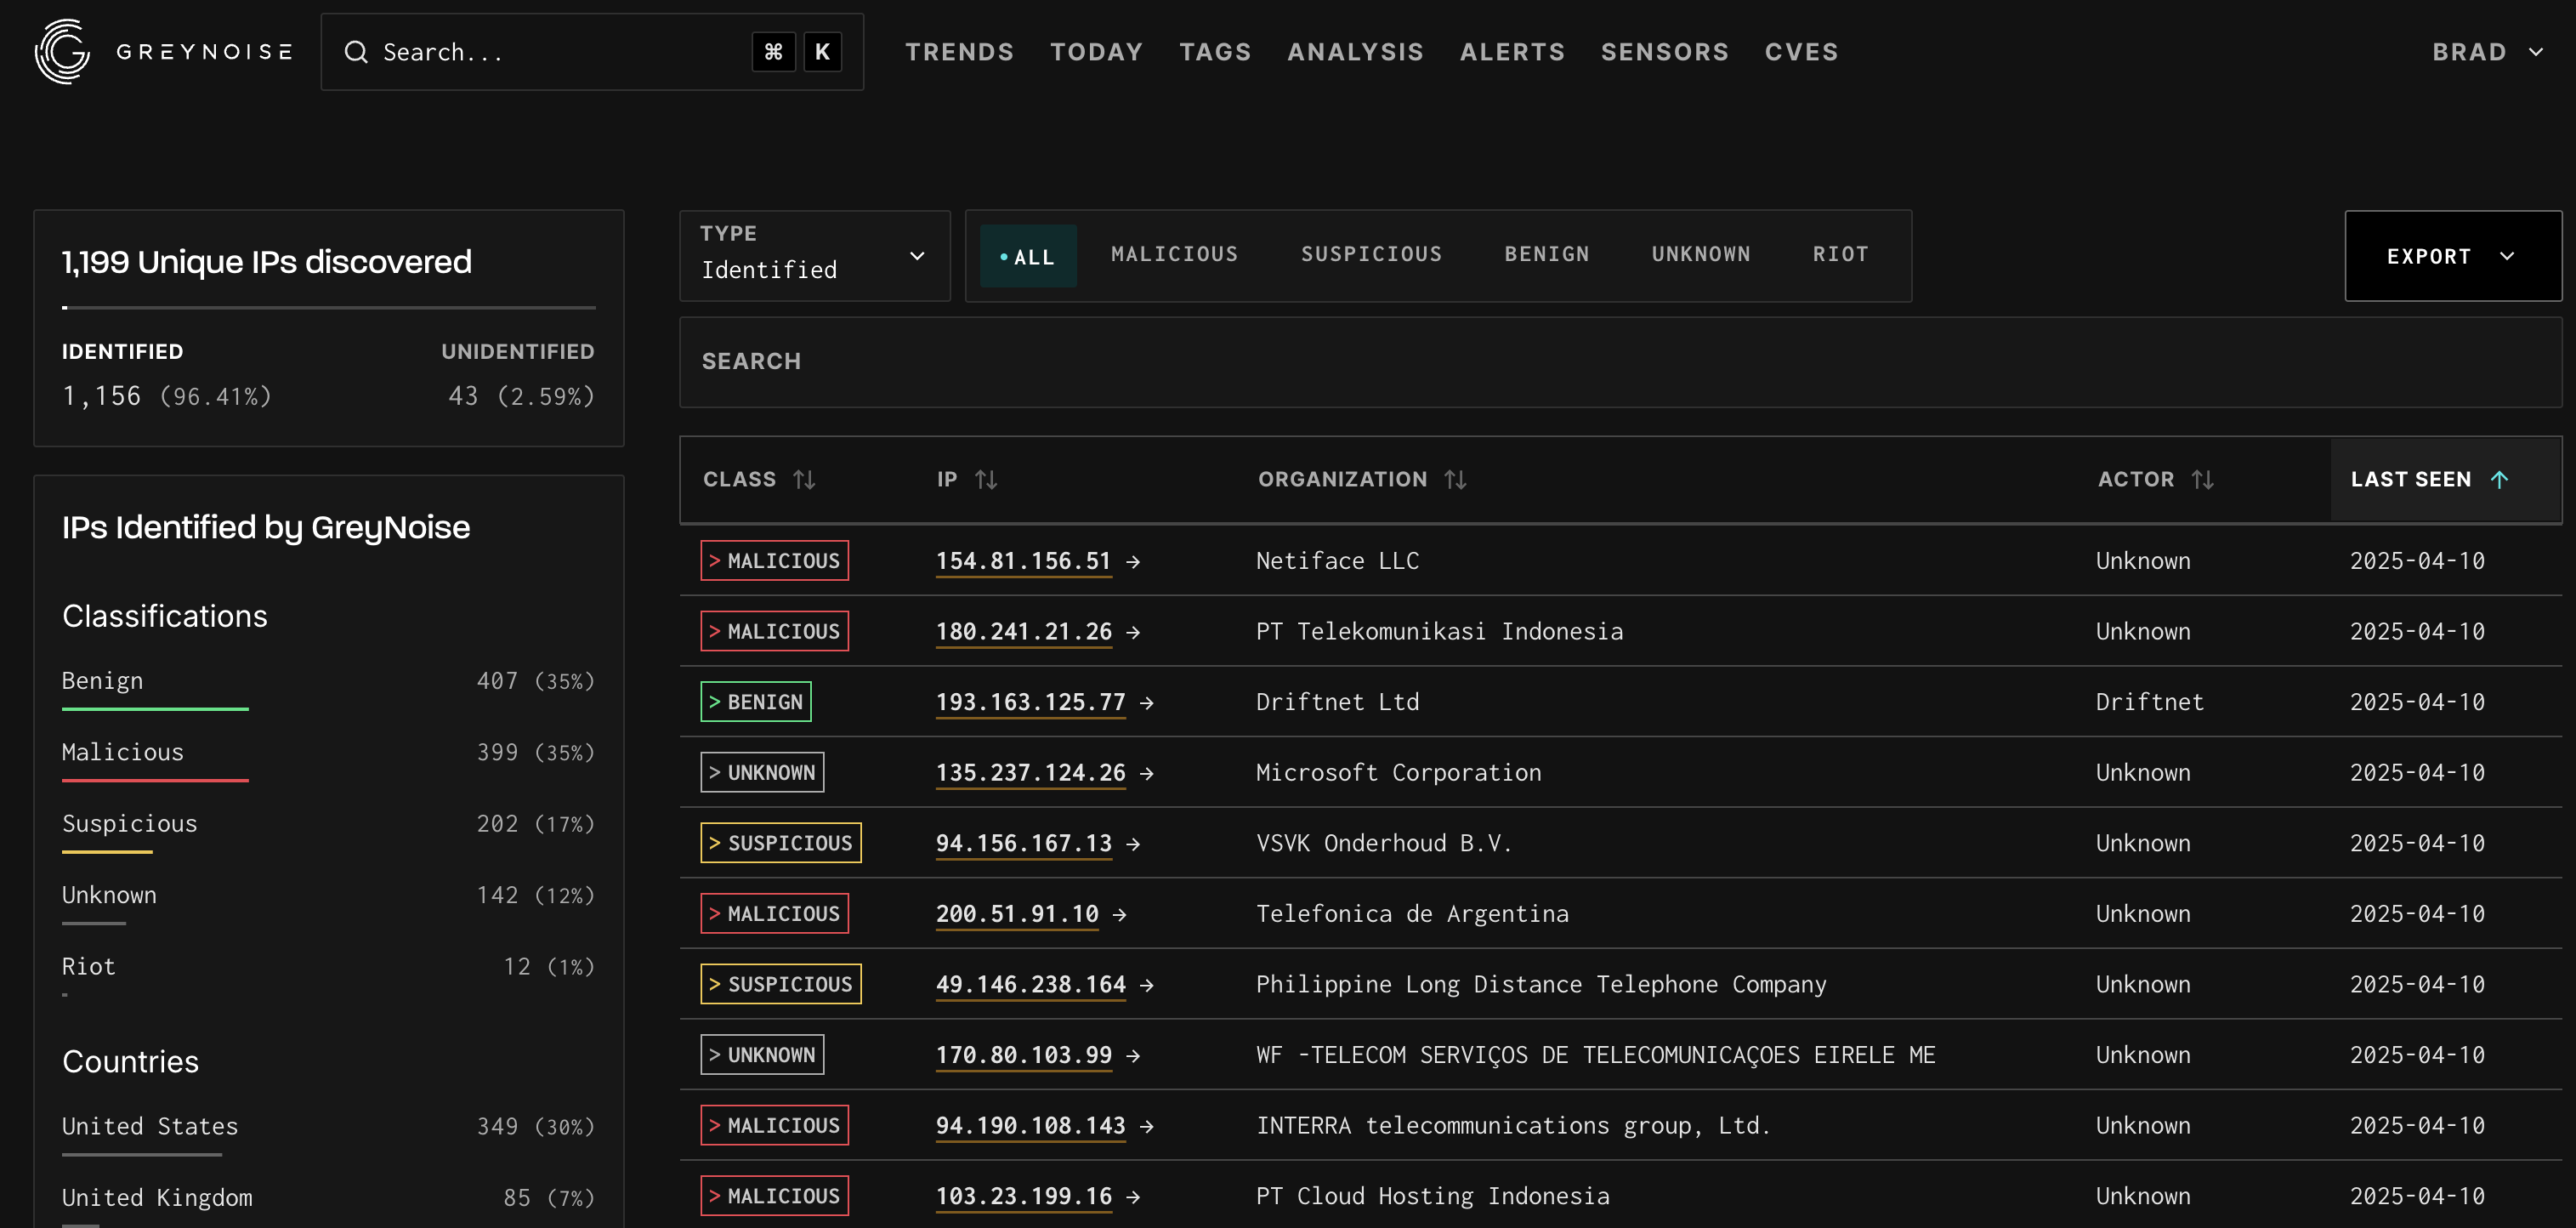
Like the search results page, the analysis results page provides a breakdown of all IPv4 addresses parsable from the input.
The top left sidebar provides a breakdown of the total number of lines and unique IPs and then shows the total number of identified IPs.
The bottom left sidebar provides the breakdown of classification, countries, tags, and OSes for Noise IPs.
The right panel provides the full list of IPs GreyNoise knows about with visible Organization, Classification, and Last Seen information.
Customers with an active subscription can also export the analysis results using the Export button at the top of the results list. Available Export options are JSON and CSV
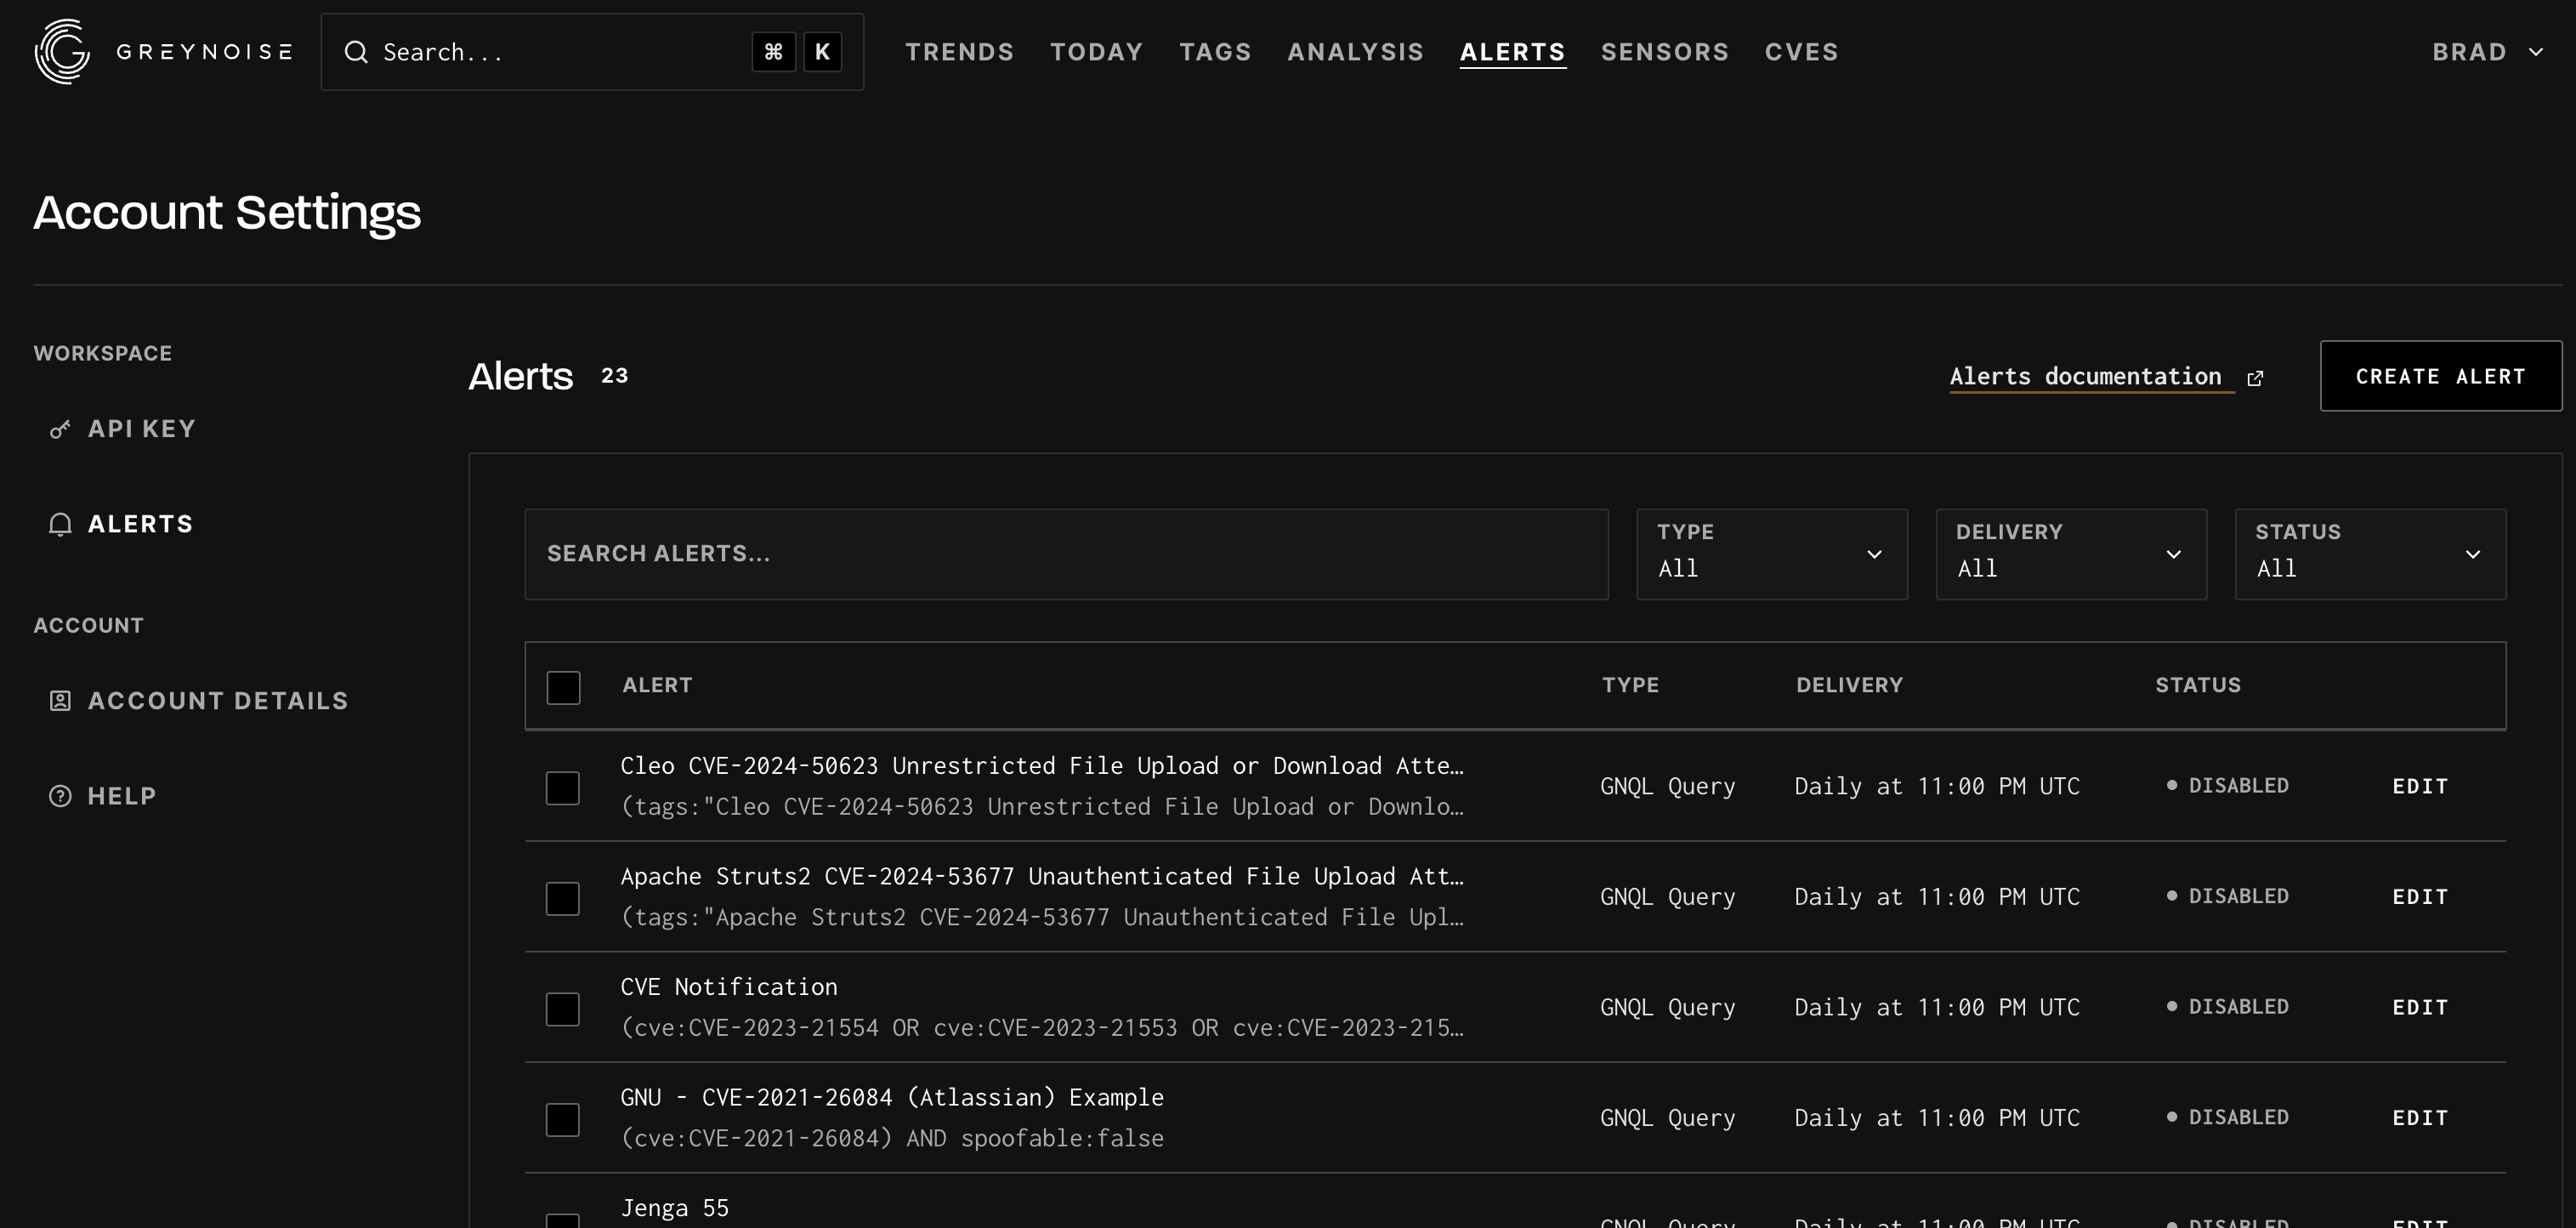
Setting up an Alert
GreyNoise alerts are used to send an email alert when an IP matching the provided alert configuration (either by CIDR or GNQL search) is observed scanning the Internet.
For example, if a corporation owns CIDR block 54.24.0.0/16, GreyNoise alerts can notify an admin if any IP within that CIDR block suddenly begins scanning the internet.
The alerts functionally can be accessed at https://viz.greynoise.io/account/alerts. Full documentation on the alerts functionality can be found here.
Updated over 1 year ago