
Elasticsearch Installation Guide
Overview
This integration enables seamless ingestion, enrichment, and visualization of GreyNoise threat intelligence data within Elastic Security. It supports continuous collection of GreyNoise indicators and enriches security events with contextual threat intelligence, including malicious classifications, scanner identification, ASN information, VPN/Tor detection, and actor context.
The integration also provides native Kibana dashboards, ECS-compatible enrichment, and support for Elastic Security detection rules, Indicator Match workflows, and threat hunting investigations.
Release Notes
Here is the link for the latest changelog.
Compatibility Matrix
- Browser: Google Chrome, Mozilla Firefox
- OS: Platform independent.
- Elastic Version: ^8.17.0
Capability to Ingest GreyNoise Feed Data into an Elasticsearch Index
This integration enables ingestion of GreyNoise feed data directly into Elasticsearch indices for advanced searching, correlation, threat hunting, and long-term retention. The indexed documents contain complete GreyNoise enrichment and indicator information for each ingested IP indicator.
Installation
-
In Kibana, go to Management > Integrations.
-
In the "Search for integrations" search bar, type GreyNoise.
-
Click the GreyNoise integration from the search results.
-
Click the Add GreyNoise button to add the integration.
-
While adding the integration, provide the following details to collect logs via REST API:
-
API Key
The GreyNoise API key used to authenticate API requests. -
Interval
The duration between consecutive requests to the GreyNoise API. Due to API limitations, this value must be greater than 1 hour. Supported time units: h. Default: 24h -
Query (Optional)
A query used to filter the results returned by the API. Do not include the last_seen field in the query, as it is automatically set to a fixed value of 1d. Default: classification:malicious -
Page Size
The number of results returned per page when paginating through query results. The maximum supported value is 5000. Default: 5000 -
HTTP Client Timeout
The duration before the HTTP client considers a connection attempt timed out. Supported time units: ns, us, ms, s, m, h. Default: 5m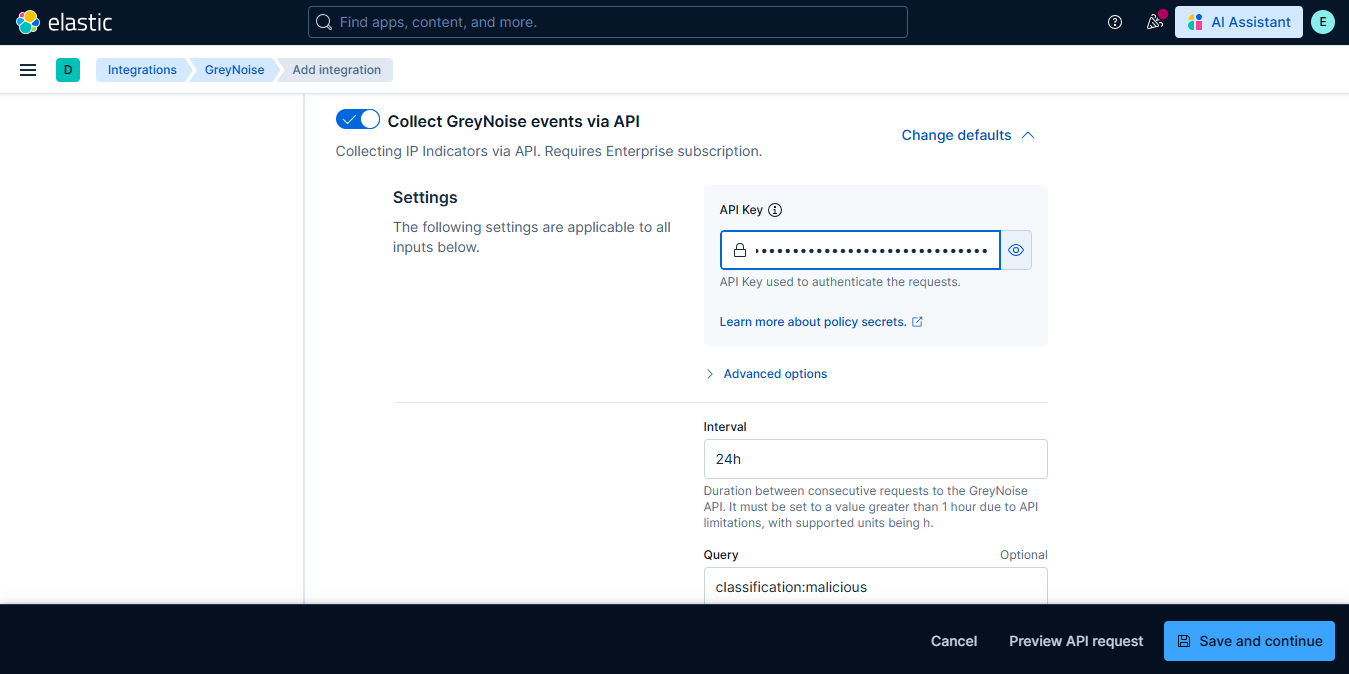
-
-
If required, configure any additional Elastic Agent settings such as Proxy settings, SSL/TLS configuration, Preserve Original Event, Tags, and Processors according to your environment and deployment requirements.
-
Click Save and Continue to save the integration.
The GreyNoise integration is now successfully installed and collecting IOC data from GreyNoise.
View GreyNoise IOC Data
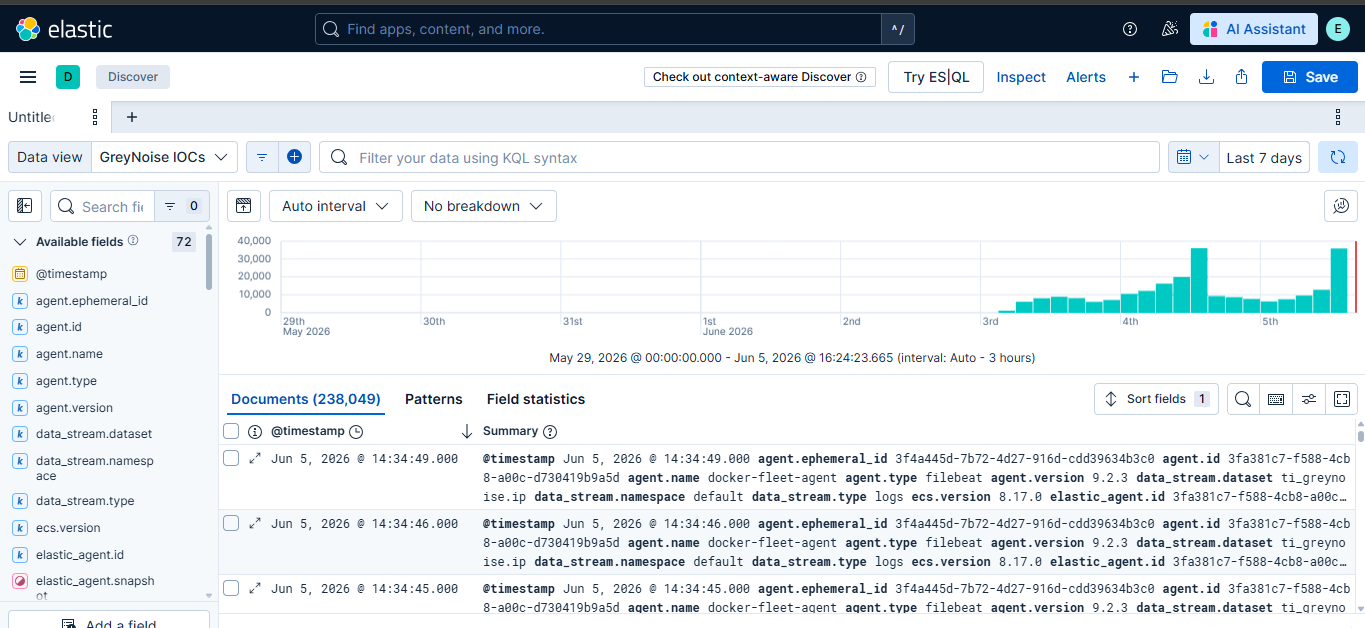
To view the collected IOC data, navigate to Discover and create a data view using the logs-ti_greynoise.ip* index pattern:
- Click the Data view drop-down in the Discover page.
- Click on Create a data view.
- Enter a name for the data view, for example, GreyNoise IOCs.
- In the Index pattern field, enter logs-ti_greynoise.ip*.
- Select @timestamp as the Timestamp field.
- Click on Save.
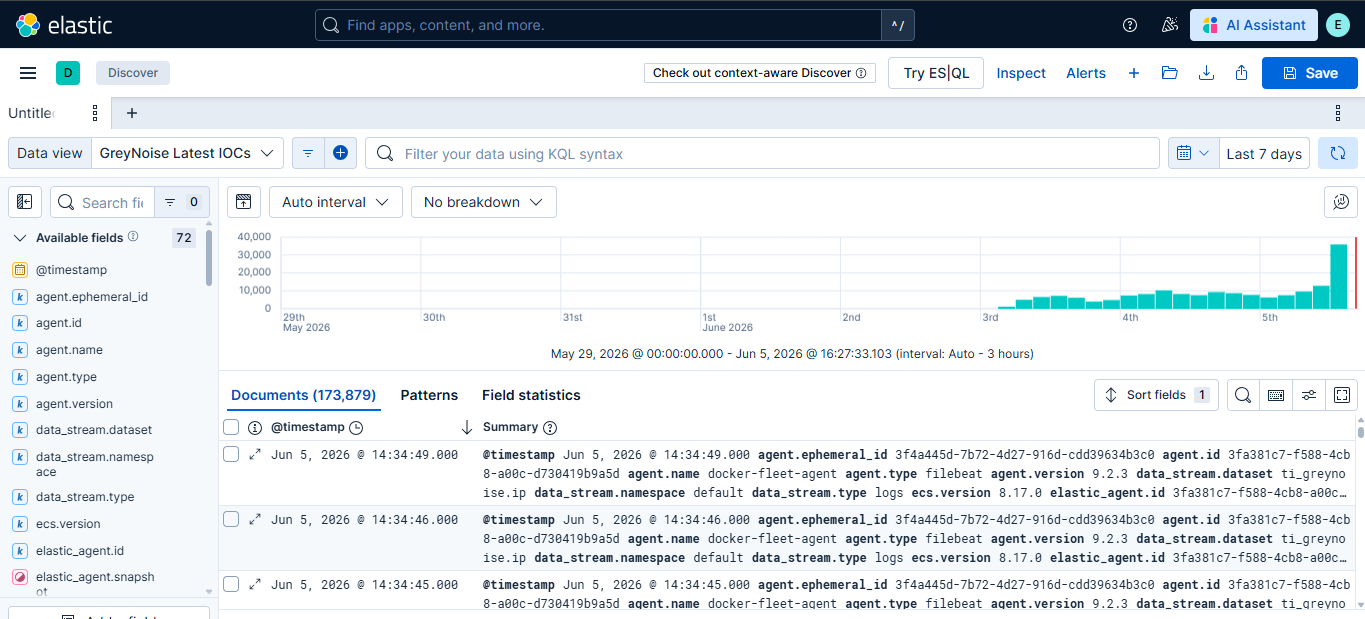
GreyNoise data may contain multiple records for the same IOC over time. To view only the most recent IOC entries, create a data view using the logs-ti_greynoise_latest.ip* pattern:
- Click the Data view drop-down in the Discover page.
- Click on Create a data view.
- Enter a name for the data view, for example, GreyNoise Latest IOCs.
- In the Index pattern field, enter logs-ti_greynoise.ip*.
- Select @timestamp as the Timestamp field.
- Click on Save.
Support for Elastic Security - Threat Intelligence
GreyNoise Integration for Elasticsearch provides integration with Elastic Security Threat Intelligence workflows. GreyNoise indicator data can be leveraged within Elastic Security for threat enrichment, Indicator Match rules, Timeline investigations, and custom detection pipelines.
Enrichment with detection rules
Detection Rules match your Elastic environment data with GreyNoise data and generate an alert when a match is found.
Steps to create a detection rule
-
Navigate to Security > Rules > Detection Rules and click Create New Rule.
-
Select Indicator Match as the rule type and make the following changes.
-
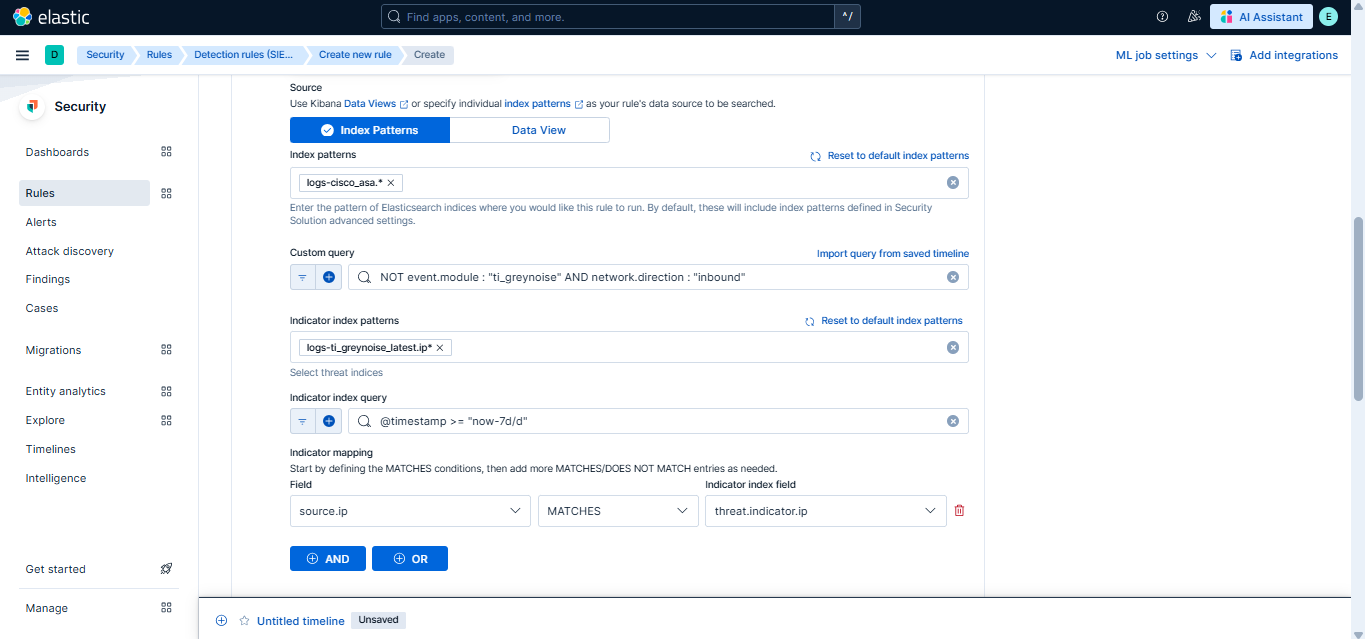
In the Define Rule section:
-
Index Pattern: Add the index pattern relevant to the data you want to monitor. For best results, use perimeter or network traffic data, such as firewall, IDS/IPS, VPN, proxy, or network flow logs (for example,
logs-panw.*,logs-cisco_asa.*, orlogs-suricata.*). Keep the pattern as specific as possible for better performance. -
Custom Query: Must include
NOT event.module : "ti_greynoise"to exclude GreyNoise events. Optionally, further refine the query to focus on specific types of traffic. For example:- Inbound network traffic only:
NOT event.module : "ti_greynoise" AND network.direction : "inbound" - Successful inbound connections only:
NOT event.module : "ti_greynoise" AND network.direction : "inbound" AND event.outcome : "success" - Firewall allow events only:
NOT event.module : "ti_greynoise" AND event.category : "network" AND event.type : "allowed"
- Inbound network traffic only:
-
Indicator index patterns: Use
logs-ti_greynoise_latest.ip*. -
Indicator index query: Refine indicator index with something like
@timestamp >= "now-7d/d". -
Indicator Mapping:
- Field: Map to the field in your Elastic environment containing IPs.
- Indicator Index Field: threat.indicator.ip
-
Required fields (Optional): Add
threat.indicator.ip. -
Related integrations (Optional): Add GreyNoise.
-
-
In the About Rule section:
-
Name: e.g
GreyNoise Custom IP IOC Correlation. -
Description: e.g.,
This rule is triggered when IP Address IOC's collected from the GreyNoise Integration have a match against IP Addresses that were found in the customer environment. -
Default Severity: e.g.,
critical. -
Tags: Add
GreyNoise(used for filter Alerts generated by this rule by rule transforms).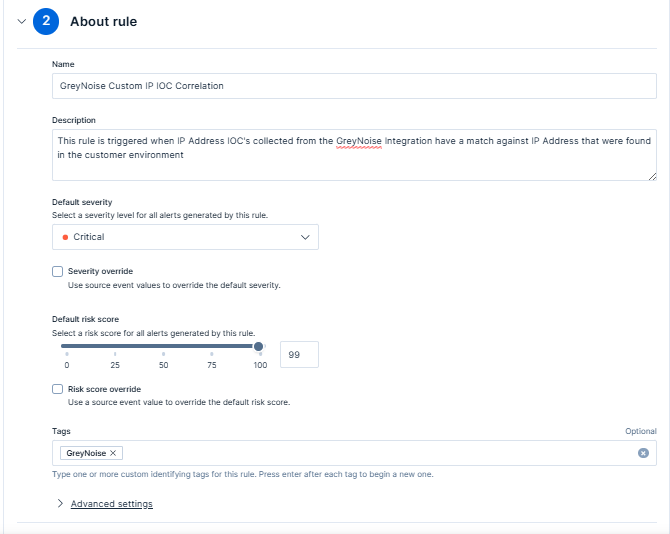
-
Max alerts per run: Default is 100; configurable up to 1000.
-
Indicator prefix override: Set to
greynoise.ipto enrich alerts with GreyNoise data.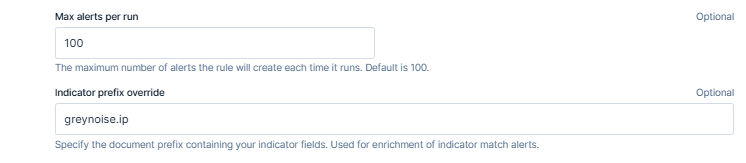
-
-
In the Schedule Rules section:
-
Set Runs Every - Defines how frequently the rule runs.
-
Additional Lookback Time - Specifies how far back to check for matches.
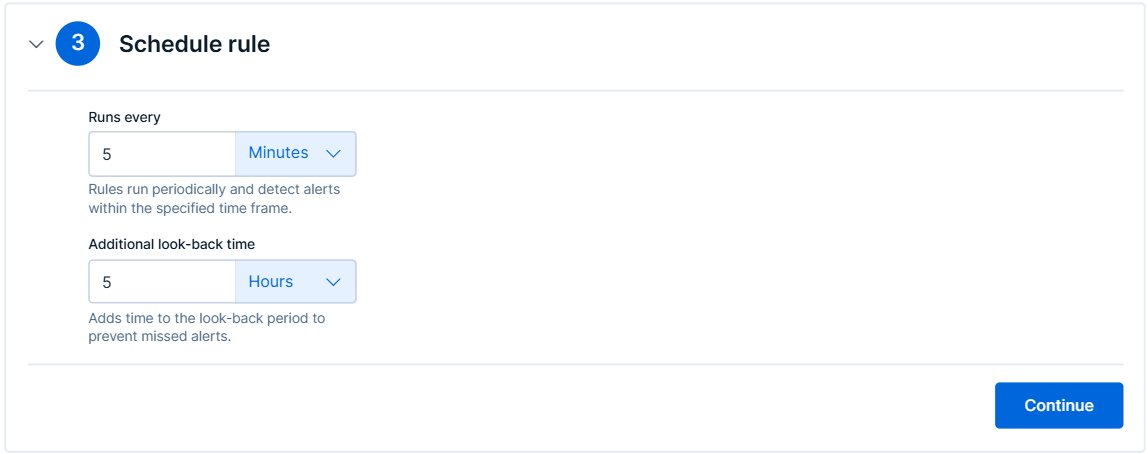
-
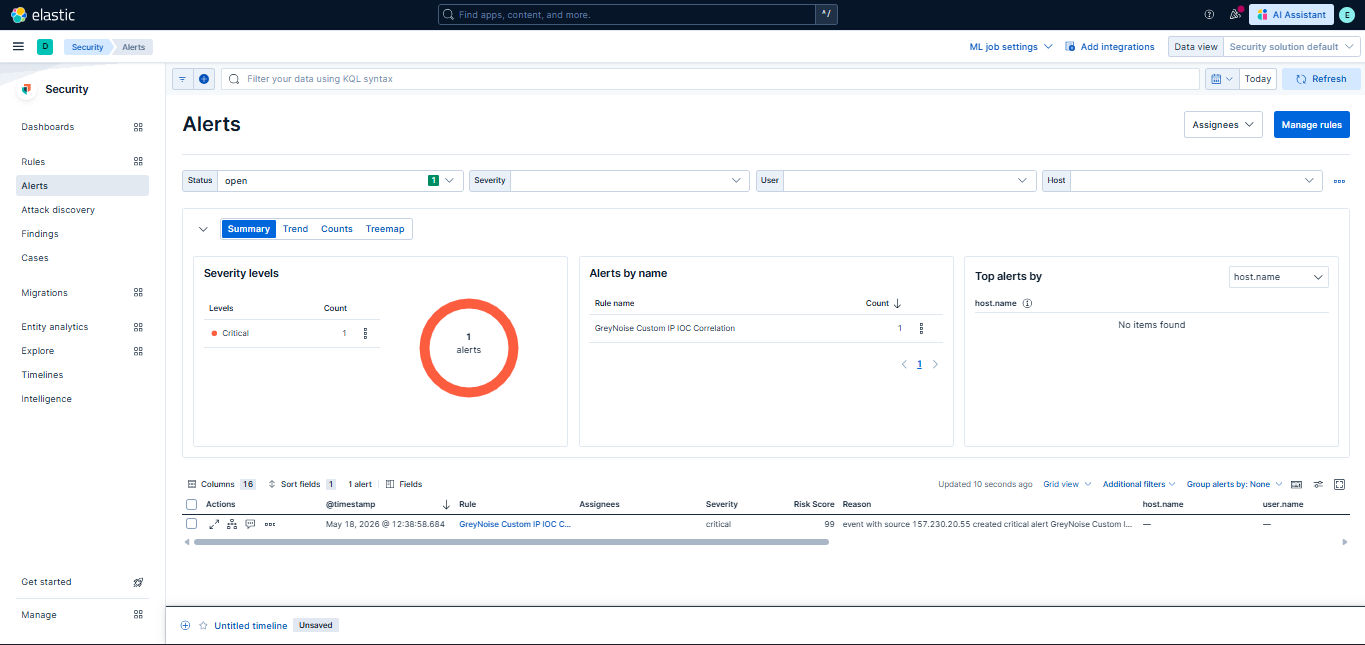
Once the rule is saved and enabled, alerts will appear in the Security > Alerts section when matches are detected.
The following transform and its associated pipelines are used to filter relevant data from alerts. Follow Steps to enable rule transforms to enable these transforms and populate the Threat Intelligence dashboard.
| Transform Name Description | Transform Name Description |
|---|---|
Detected IOC Transform (ID: logs-ti_greynoise.rule, Pipeline: ti_greynoise-correlation_detection_rule-pipeline) | Filters and extracts the necessary information from Detected IOCs. |
Steps to enable rule transforms
-
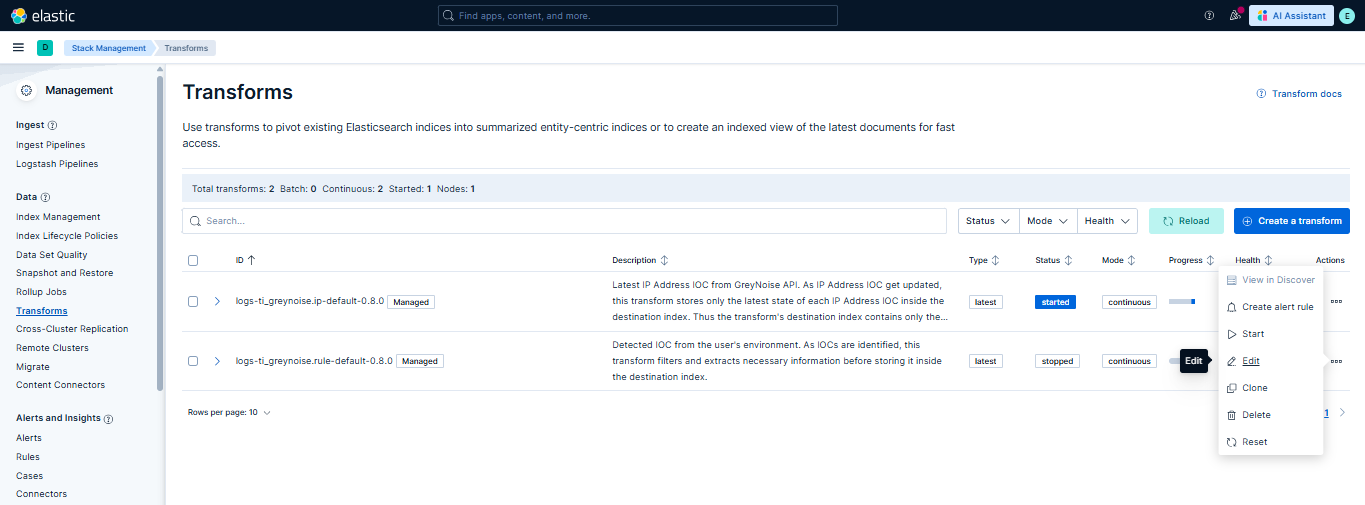
Navigate to Stack Management > Transforms in Kibana.
-
Locate the transform you want to enable by searching for its Transform ID.
-
Click the three dots next to the transform, then select Edit.
-
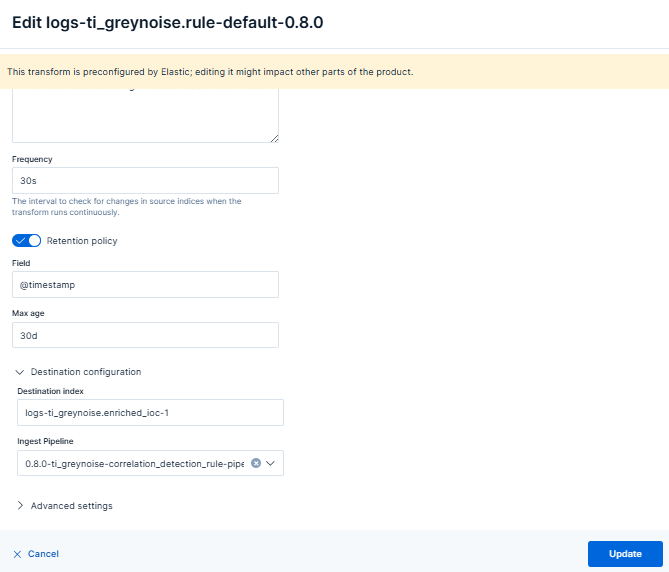
Under the Destination configuration section, set the Ingest Pipeline:
-
Rule transform in the GreyNoise integration has a corresponding ingest pipeline.
-
Refer to the Transforms table above for the appropriate pipeline name associated with the transform.
-
Prefix the pipeline name with the integration version. For example:
{package_version}-ti_greynoise-correlation_detection_rule-pipeline -
Click Update to save the changes.
-
-
Click the three dots again next to the transform and select Start to activate it.
For Upgrades
Follow the steps described in the provided guide to upgrade the Elastic integration.
Note:
- Updating the integration will stop the rule transform.
- After the integration upgrade is completed, reconfigure the rule transform by adding the pipeline for the updated integration version, as described in Steps to enable rule transforms section above.
Dashboards
The GreyNoise integration includes the following dashboards:
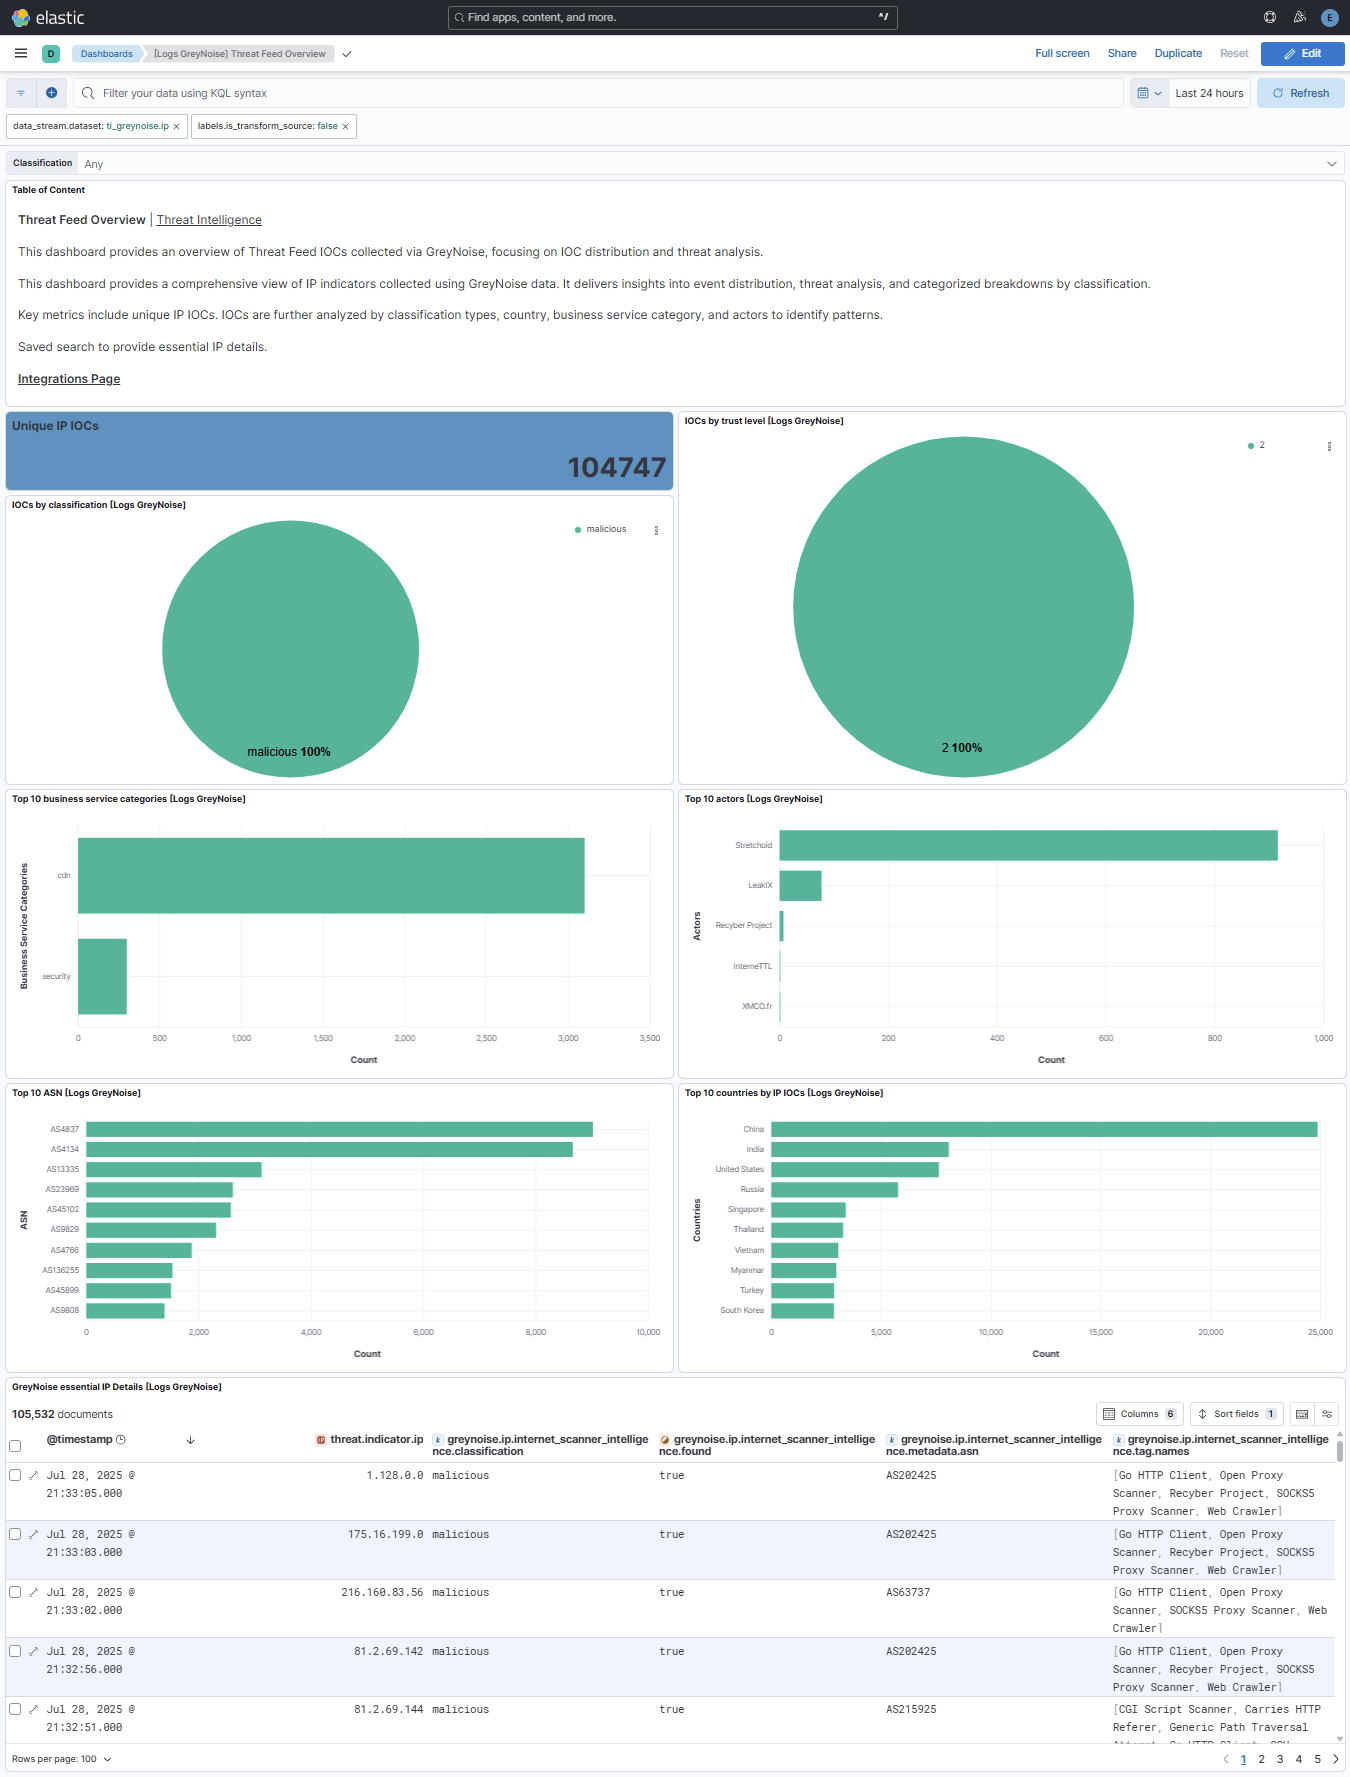
- Threat Feed Overview:
- This dashboard provides an overview of Threat Feed IOCs collected via GreyNoise, focusing on IOC distribution and threat analysis.
- This dashboard provides a comprehensive view of IP indicators collected using GreyNoise data. It delivers insights into event distribution, threat analysis, and categorized breakdowns by classification.
- Key metrics include unique IP IOCs. IOCs are further analyzed by classification types, country, business service category, and actors to identify patterns.
- Saved search to provide essential IP details.
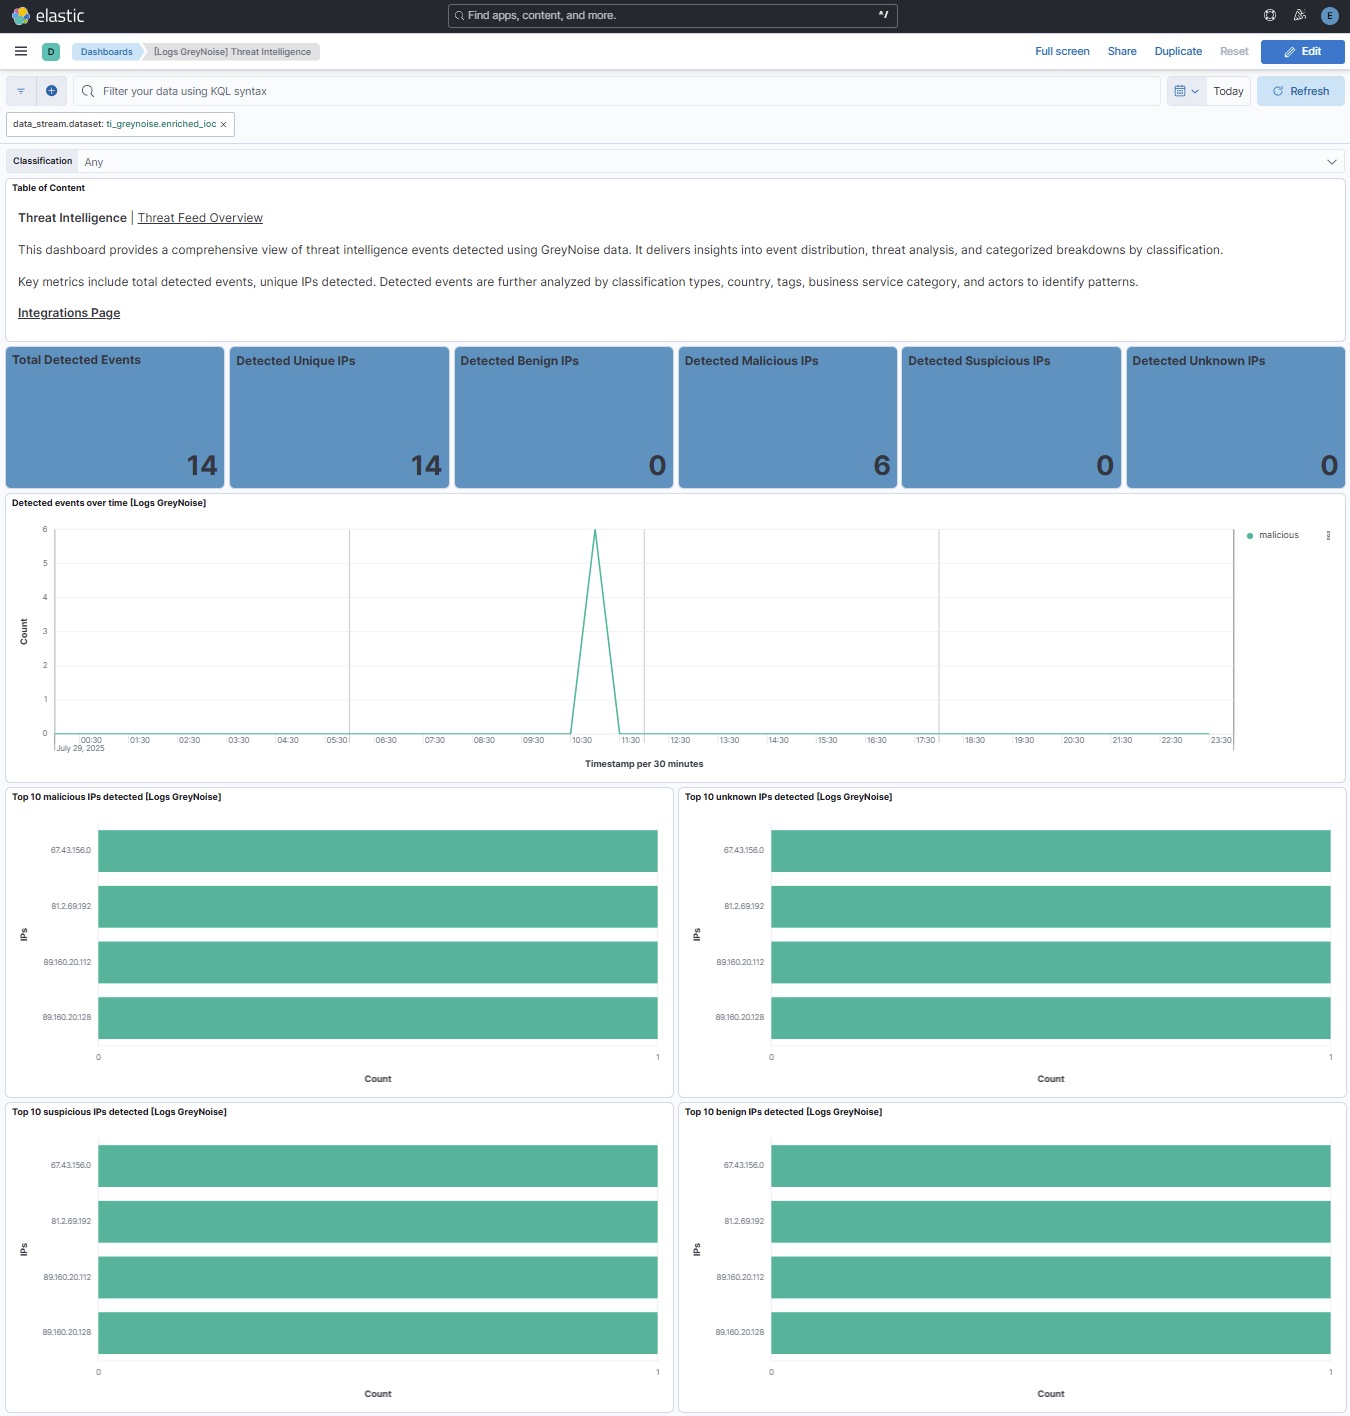
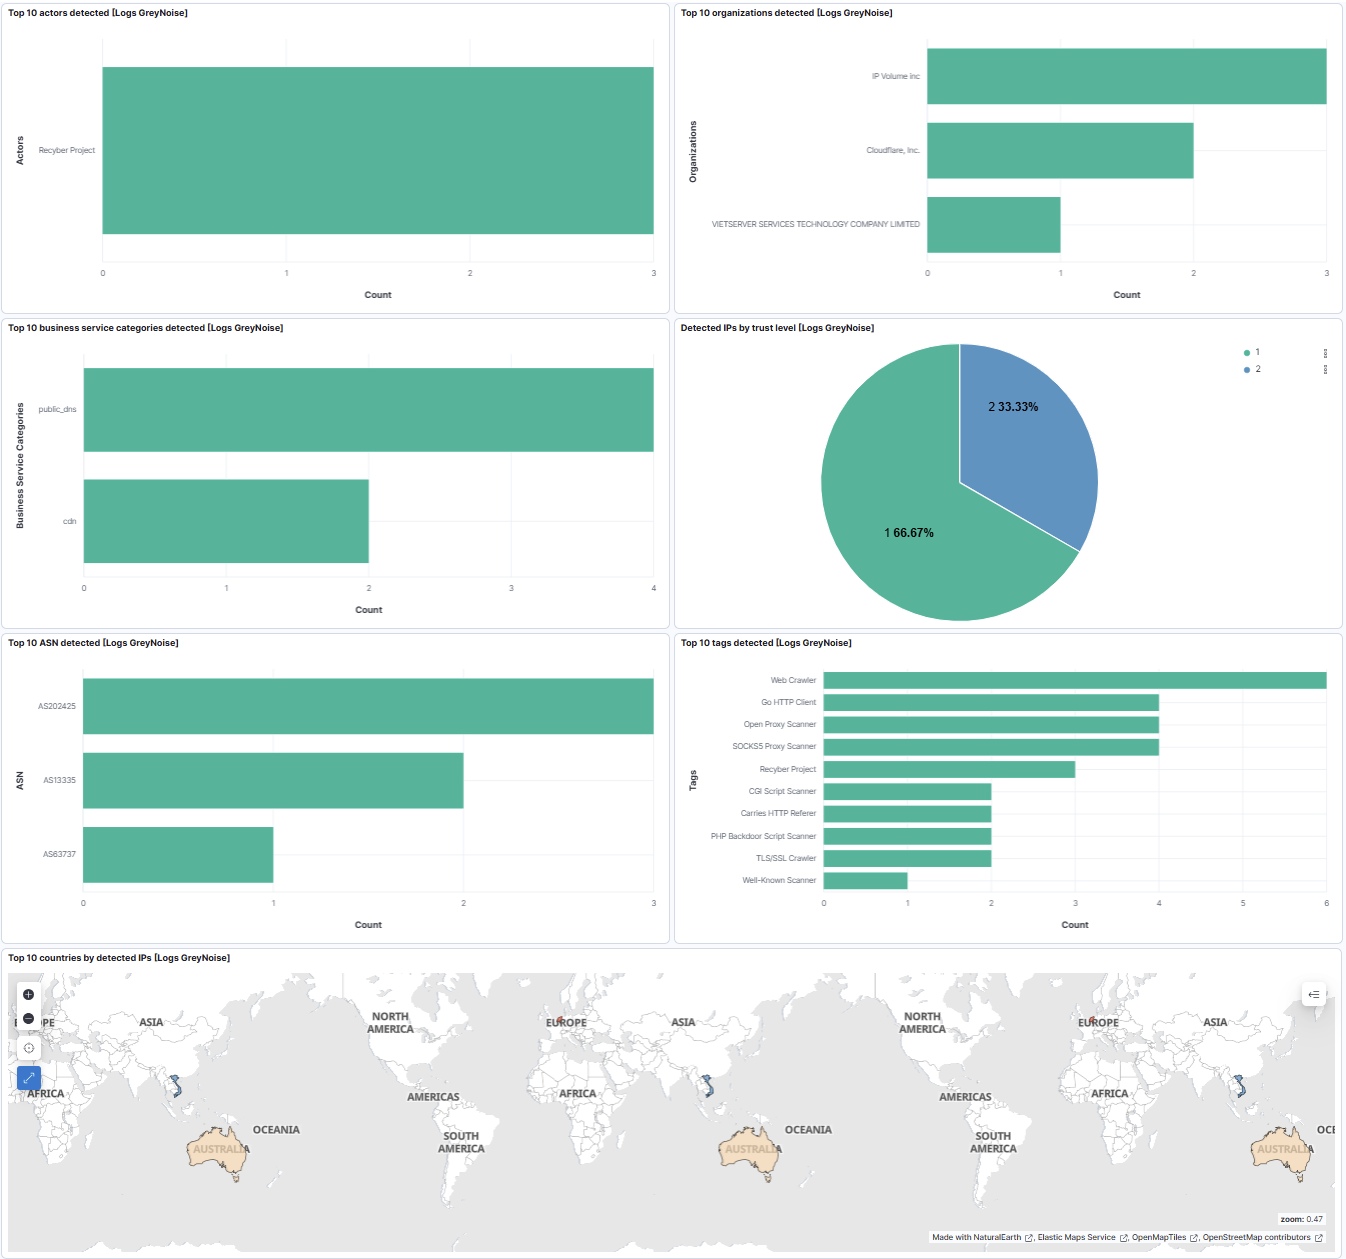
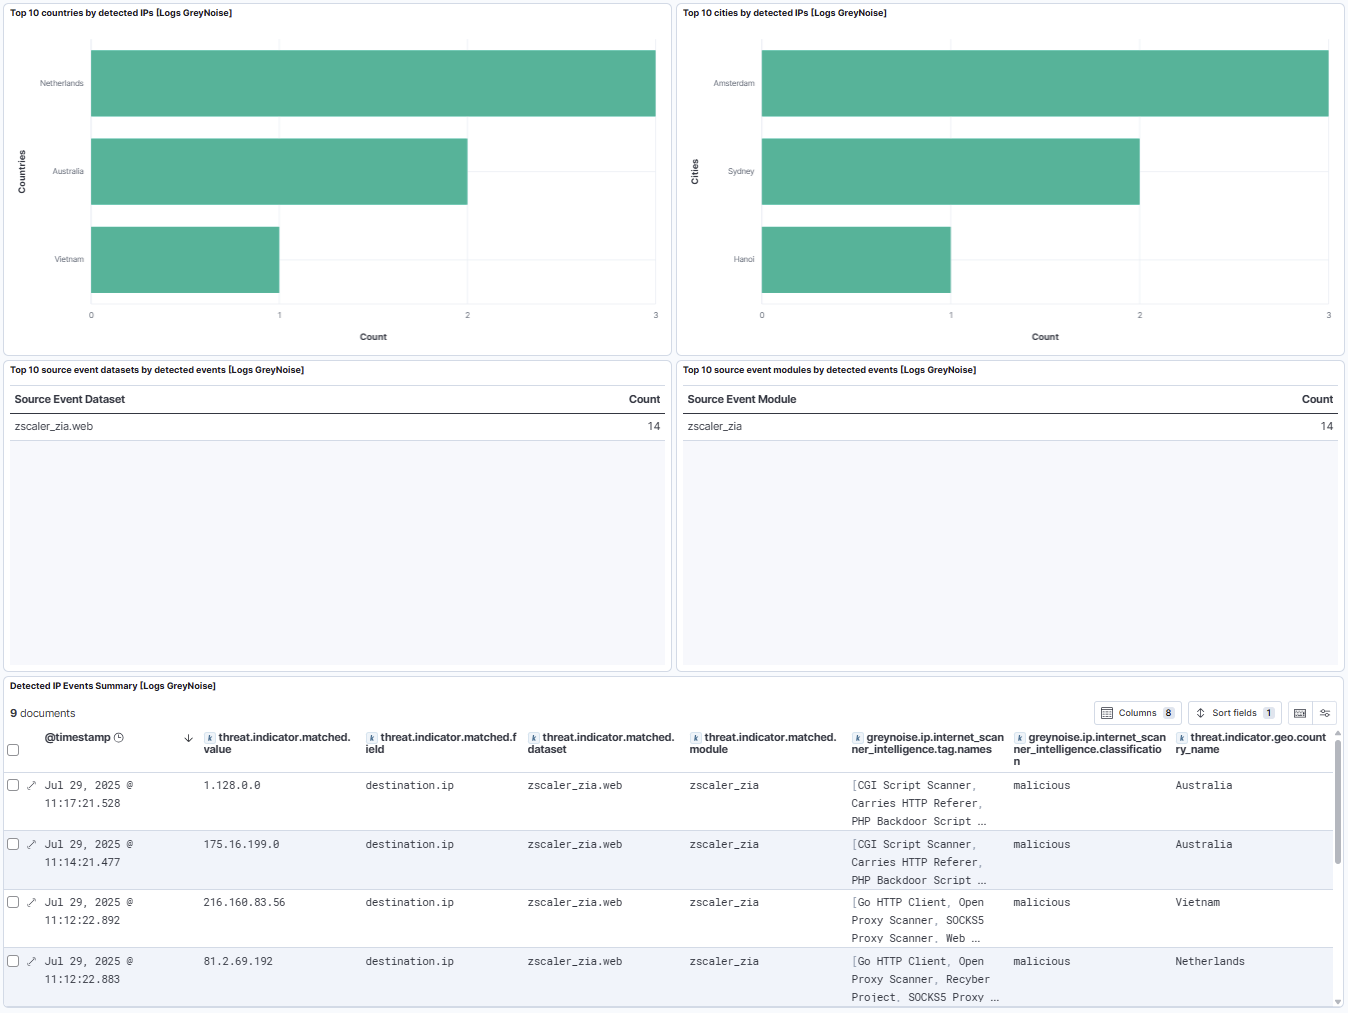
- Threat Intelligence:
- This dashboard provides a comprehensive view of threat intelligence events detected using GreyNoise data. It delivers insights into event distribution, threat analysis, and categorized breakdowns by classification.
- Key metrics include the total number of detected events and the number of unique IPs detected. Detected events are further analyzed by classification types, country, tags, business service category, and actors to identify patterns.
Updated about 1 month ago