
Intelligence Dashboards
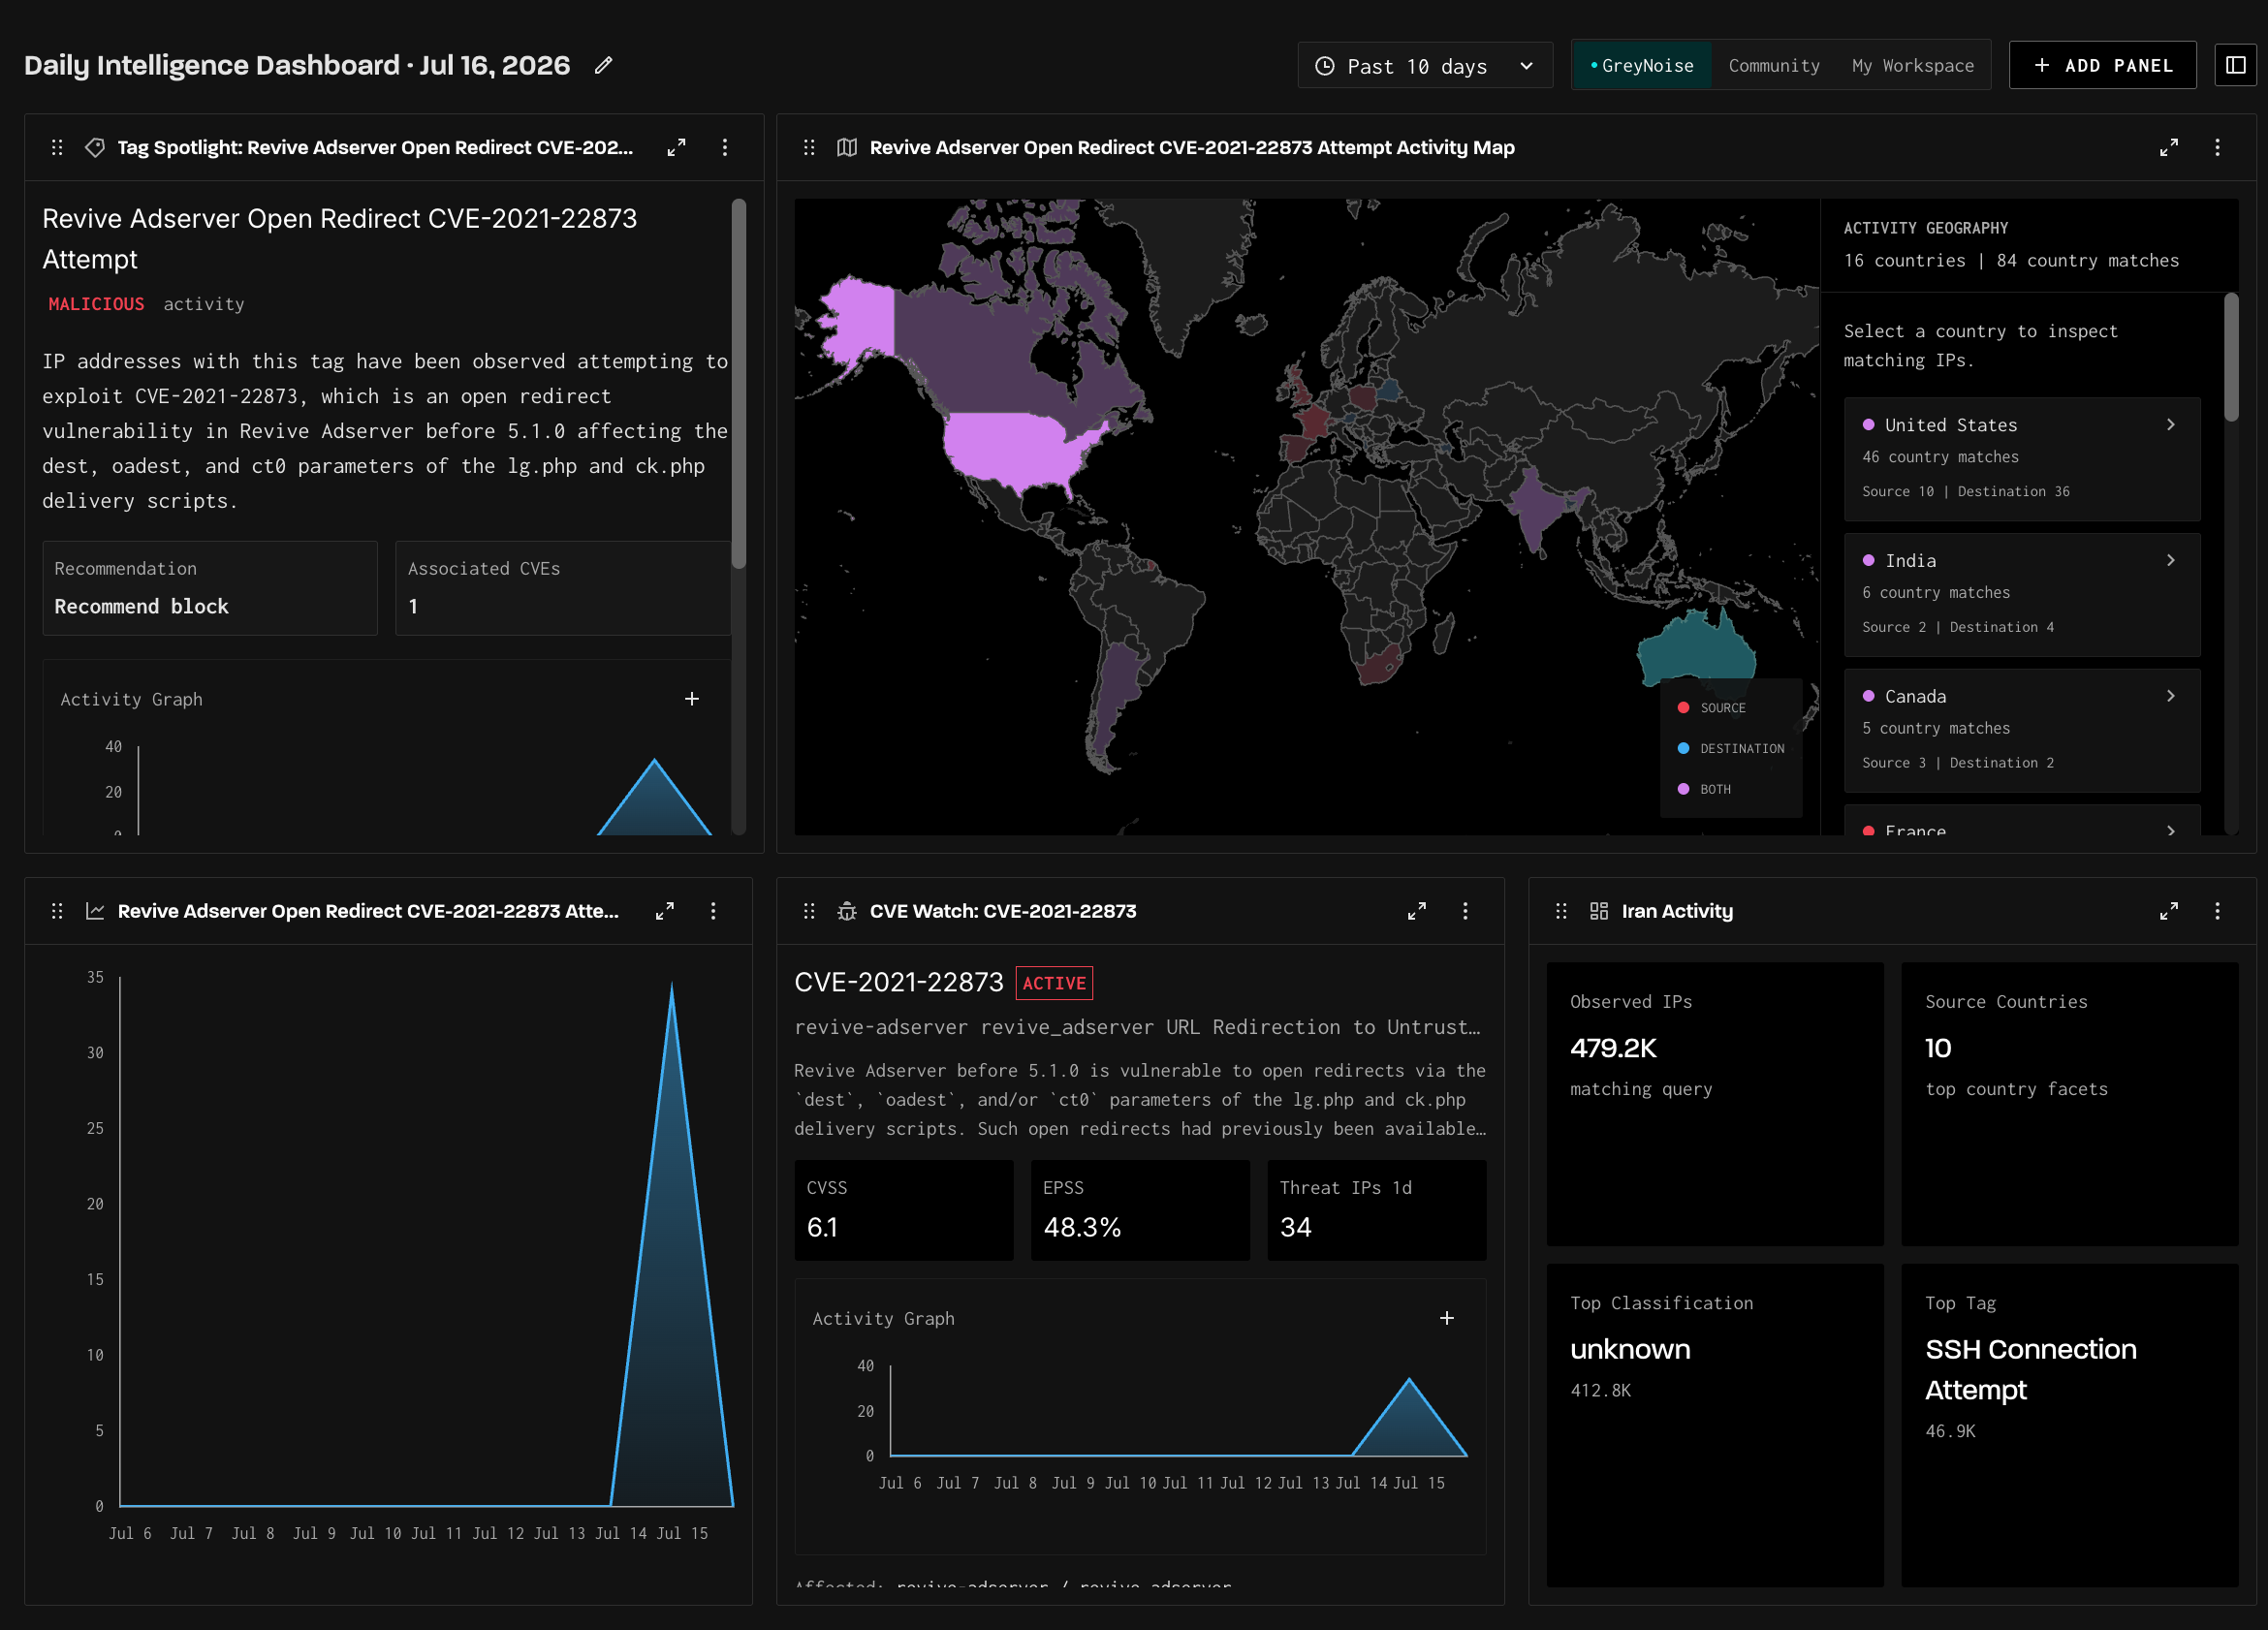
The Intelligence Dashboard lets you build persistent, customizable views of the GreyNoise intelligence you care about most, such as specific CVEs, tags, countries, IPs, or custom GNQL queries, so you can monitor them at a glance instead of rebuilding the same searches every day.
Instead of navigating between tag pages, CVE pages, and query results each morning, you assemble the panels you need once, save them as a dashboard, and return to an always-current view of that activity.
Who it’s for
- SOC analysts monitoring exploitation activity for the vulnerabilities and threats relevant to their environment.
- Threat intel teams tracking specific actors, tooling (via tags), or regions over time.
- Vulnerability management watching exploitation status of the CVEs they’re prioritizing.
Accessing the Dashboard
Navigate to Query → Dashboard in the GreyNoise Visualizer. You must be signed in to access the dashboards tab.
Data lookback
How far back dashboard data goes depends on your account type:
- GreyNoise customers and community users with a business email get a minimum of 10 days of lookback.
- Community users with a consumer email get 2 days of lookback.
Your first visit: the Daily Intelligence Dashboard
When you open the Dashboard without a saved dashboard selected, GreyNoise generates a Daily Intelligence Dashboard for you, date-stamped with today’s date. It’s automatically populated from what’s currently notable across the GreyNoise sensor network. Typically a trending tag spotlight, an activity map, an activity trend, and a CVE or country panel.
This daily view is a starting point, not a saved dashboard. You can edit it freely; save it if you want to keep your version, or let it regenerate fresh each day.
Building a dashboard
Creating panels
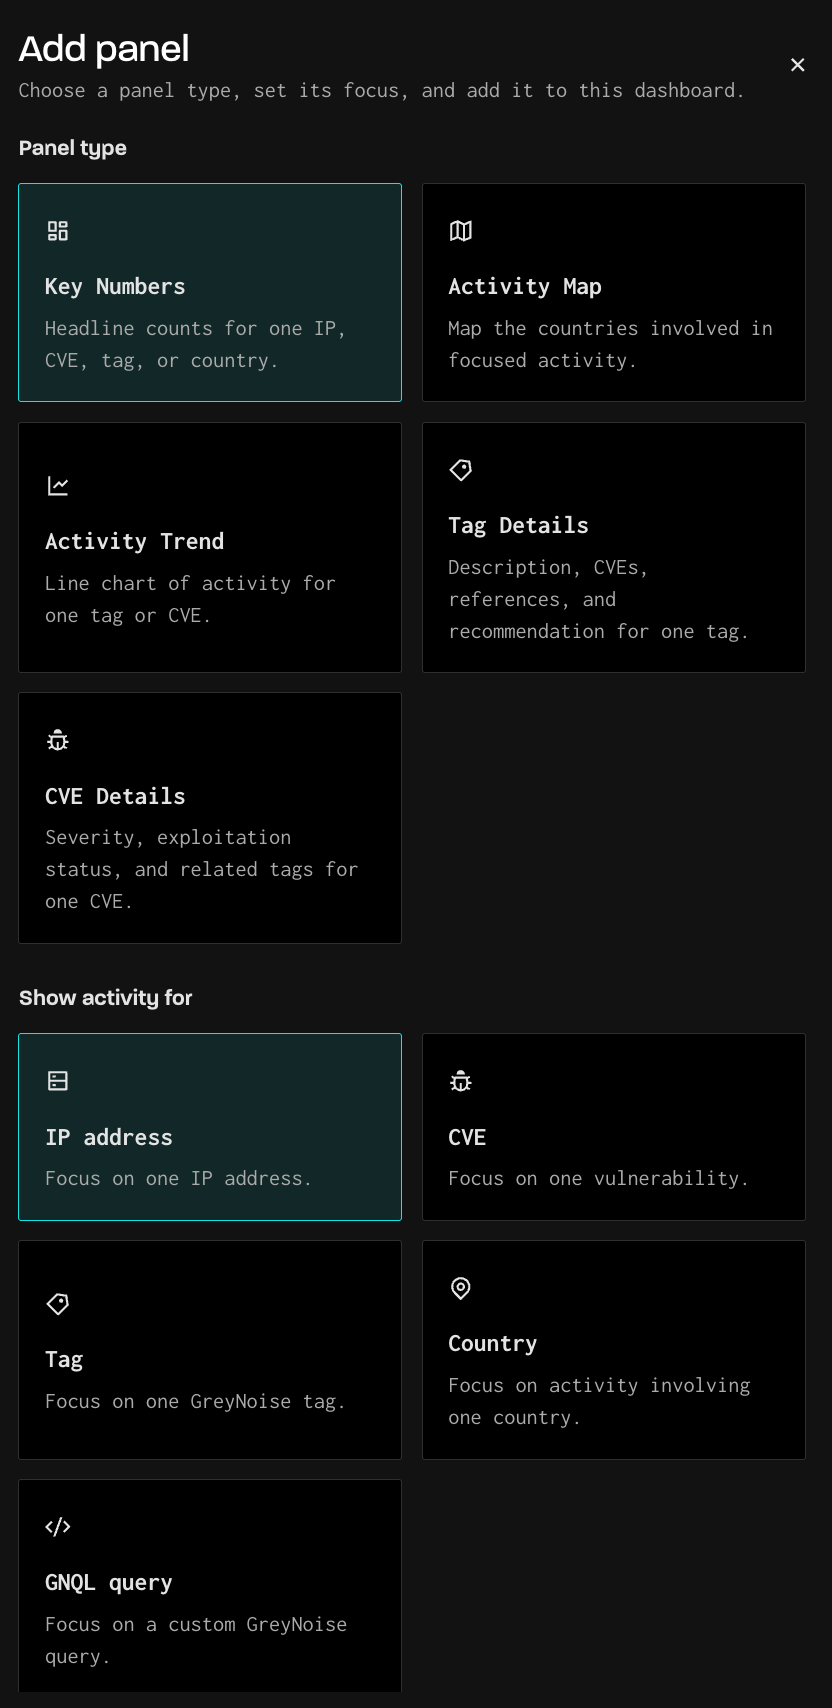
Click + Add Panel, then make two choices:
- Panel type: how the data is visualized.
- Focus: what the panel shows activity for.
Panel types:
| Panel type | What it shows |
|---|---|
| Key Numbers | Headline counts for your focus: observed IPs, source countries, top classification, and top tag. |
| Activity Map | A world map of the countries involved in the focused activity, colored by whether each country is a source of activity, a destination, or both. |
| Activity Trend | A line chart of activity over the selected time range. |
| Tag Details | The full intelligence card for one GreyNoise tag: description, classification, block/monitor recommendation, associated CVEs, references, and an activity graph. |
| CVE Details | The intelligence card for one CVE: description, active-exploitation and CISA KEV status, CVSS score, EPSS score, threat IP count over the last day, and related tags. |
Focus options:
| Focus | Description | Available for |
|---|---|---|
| IP address | One IP address | Key Numbers, Activity Map |
| CVE | One vulnerability (e.g. CVE-2021-22873) | Key Numbers, Activity Map, Activity Trend, CVE Details |
| Tag | One GreyNoise tag | Key Numbers, Activity Map, Activity Trend, Tag Details |
| Country | Activity involving one country | Key Numbers, Activity Map |
| GNQL query | Any custom GNQL query (e.g. tags:mirai classification:malicious) | Key Numbers, Activity Map, Activity Trend |
The GNQL focus is the most flexible option: any query you can run in the Visualizer can become a live dashboard panel.
Give the panel a name (a sensible default is suggested), and click Add Panel.
Arranging panels
Panels lay out on a responsive grid. Each panel’s ⋮ menu offers:
- Move Left / Move Right: reorder panels (you can also drag them).
- Edit: change the panel’s focus, filters, or name.
- Extend Width / Minimize Width: resize panels that support it (Activity Map and Activity Trend can span up to the full row).
- Remove: delete the panel from the dashboard.
Any panel can be expanded to full screen with the expand icon for a closer look.
Dashboard-wide controls
Two controls in the dashboard header apply to every panel at once:
- Time range: Past 24 hours or Past 10 days.
- Data source: which sensor data the dashboard queries:
- Community and My Workspace require a deployed Swarm sensor; once one is deployed, access is granted within about 6 hours. You can select multiple sources together.
- GreyNoise: data from GreyNoise’s global sensor network (default, available to everyone).
- Community: data from community-deployed sensors.
- My Workspace: data from sensors deployed in your own workspace.
- Community and My Workspace require a deployed Swarm sensor; once one is deployed, access is granted within about 6 hours. You can select multiple sources together.
Working with the Activity Map
The Activity Map colors countries by their role in the focused activity:
- Source (red): IPs in this country are originating the activity.
- Destination (blue): the activity is targeting this country.
- Both (purple): the country appears on both sides.
The sidebar lists each country with its match counts, split by source and destination. Click any country, on the map or in the list, to drill down to the matching IPs, grouped into IPs from this country and IPs targeting this country, with the owning organization for each. Every IP links to its full detail page, and a View all IPs in Viz link takes you to the complete result set as a GNQL query.
When creating or editing a map panel, you can pre-filter it to specific source and/or destination countries. For example, a map showing only activity targeting your operating regions.
Saving and managing dashboards
Changes you make are not saved automatically, a banner appears when you have unsaved changes, with a Save button.
The dashboard manager (panel icon in the header) lets you:
- Switch between your saved dashboards
- Search dashboards by name
- Create a new dashboard
- Delete a dashboard
Dashboards are personal to you within your workspace. You can save up to 50 dashboards, each with up to 24 panels.
Updated 3 months ago