
Splunk SIEM Dashboard Guide
Using the GreyNoise Executive Dashboard
GreyNoise Executive Dashboard
Overview
Firewall and VPN logs record every connection, including the mass scanning that hits every internet-facing organization. Sorting that volume by hand is slow, and a successful login or an allowed inbound session can get buried in the background noise.
The GreyNoise Executive Dashboard, added in version 3.1.0 of the GreyNoise App for Splunk, places that traffic next to GreyNoise Internet Scanner Intelligence. It is built for two audiences at once: an executive summary of how much traffic GreyNoise can classify, and a SOC triage view of the outcomes that need a person — allowed inbound sessions from malicious sources, internal hosts reaching malicious infrastructure, and VPN logins from addresses already in the GreyNoise dataset.
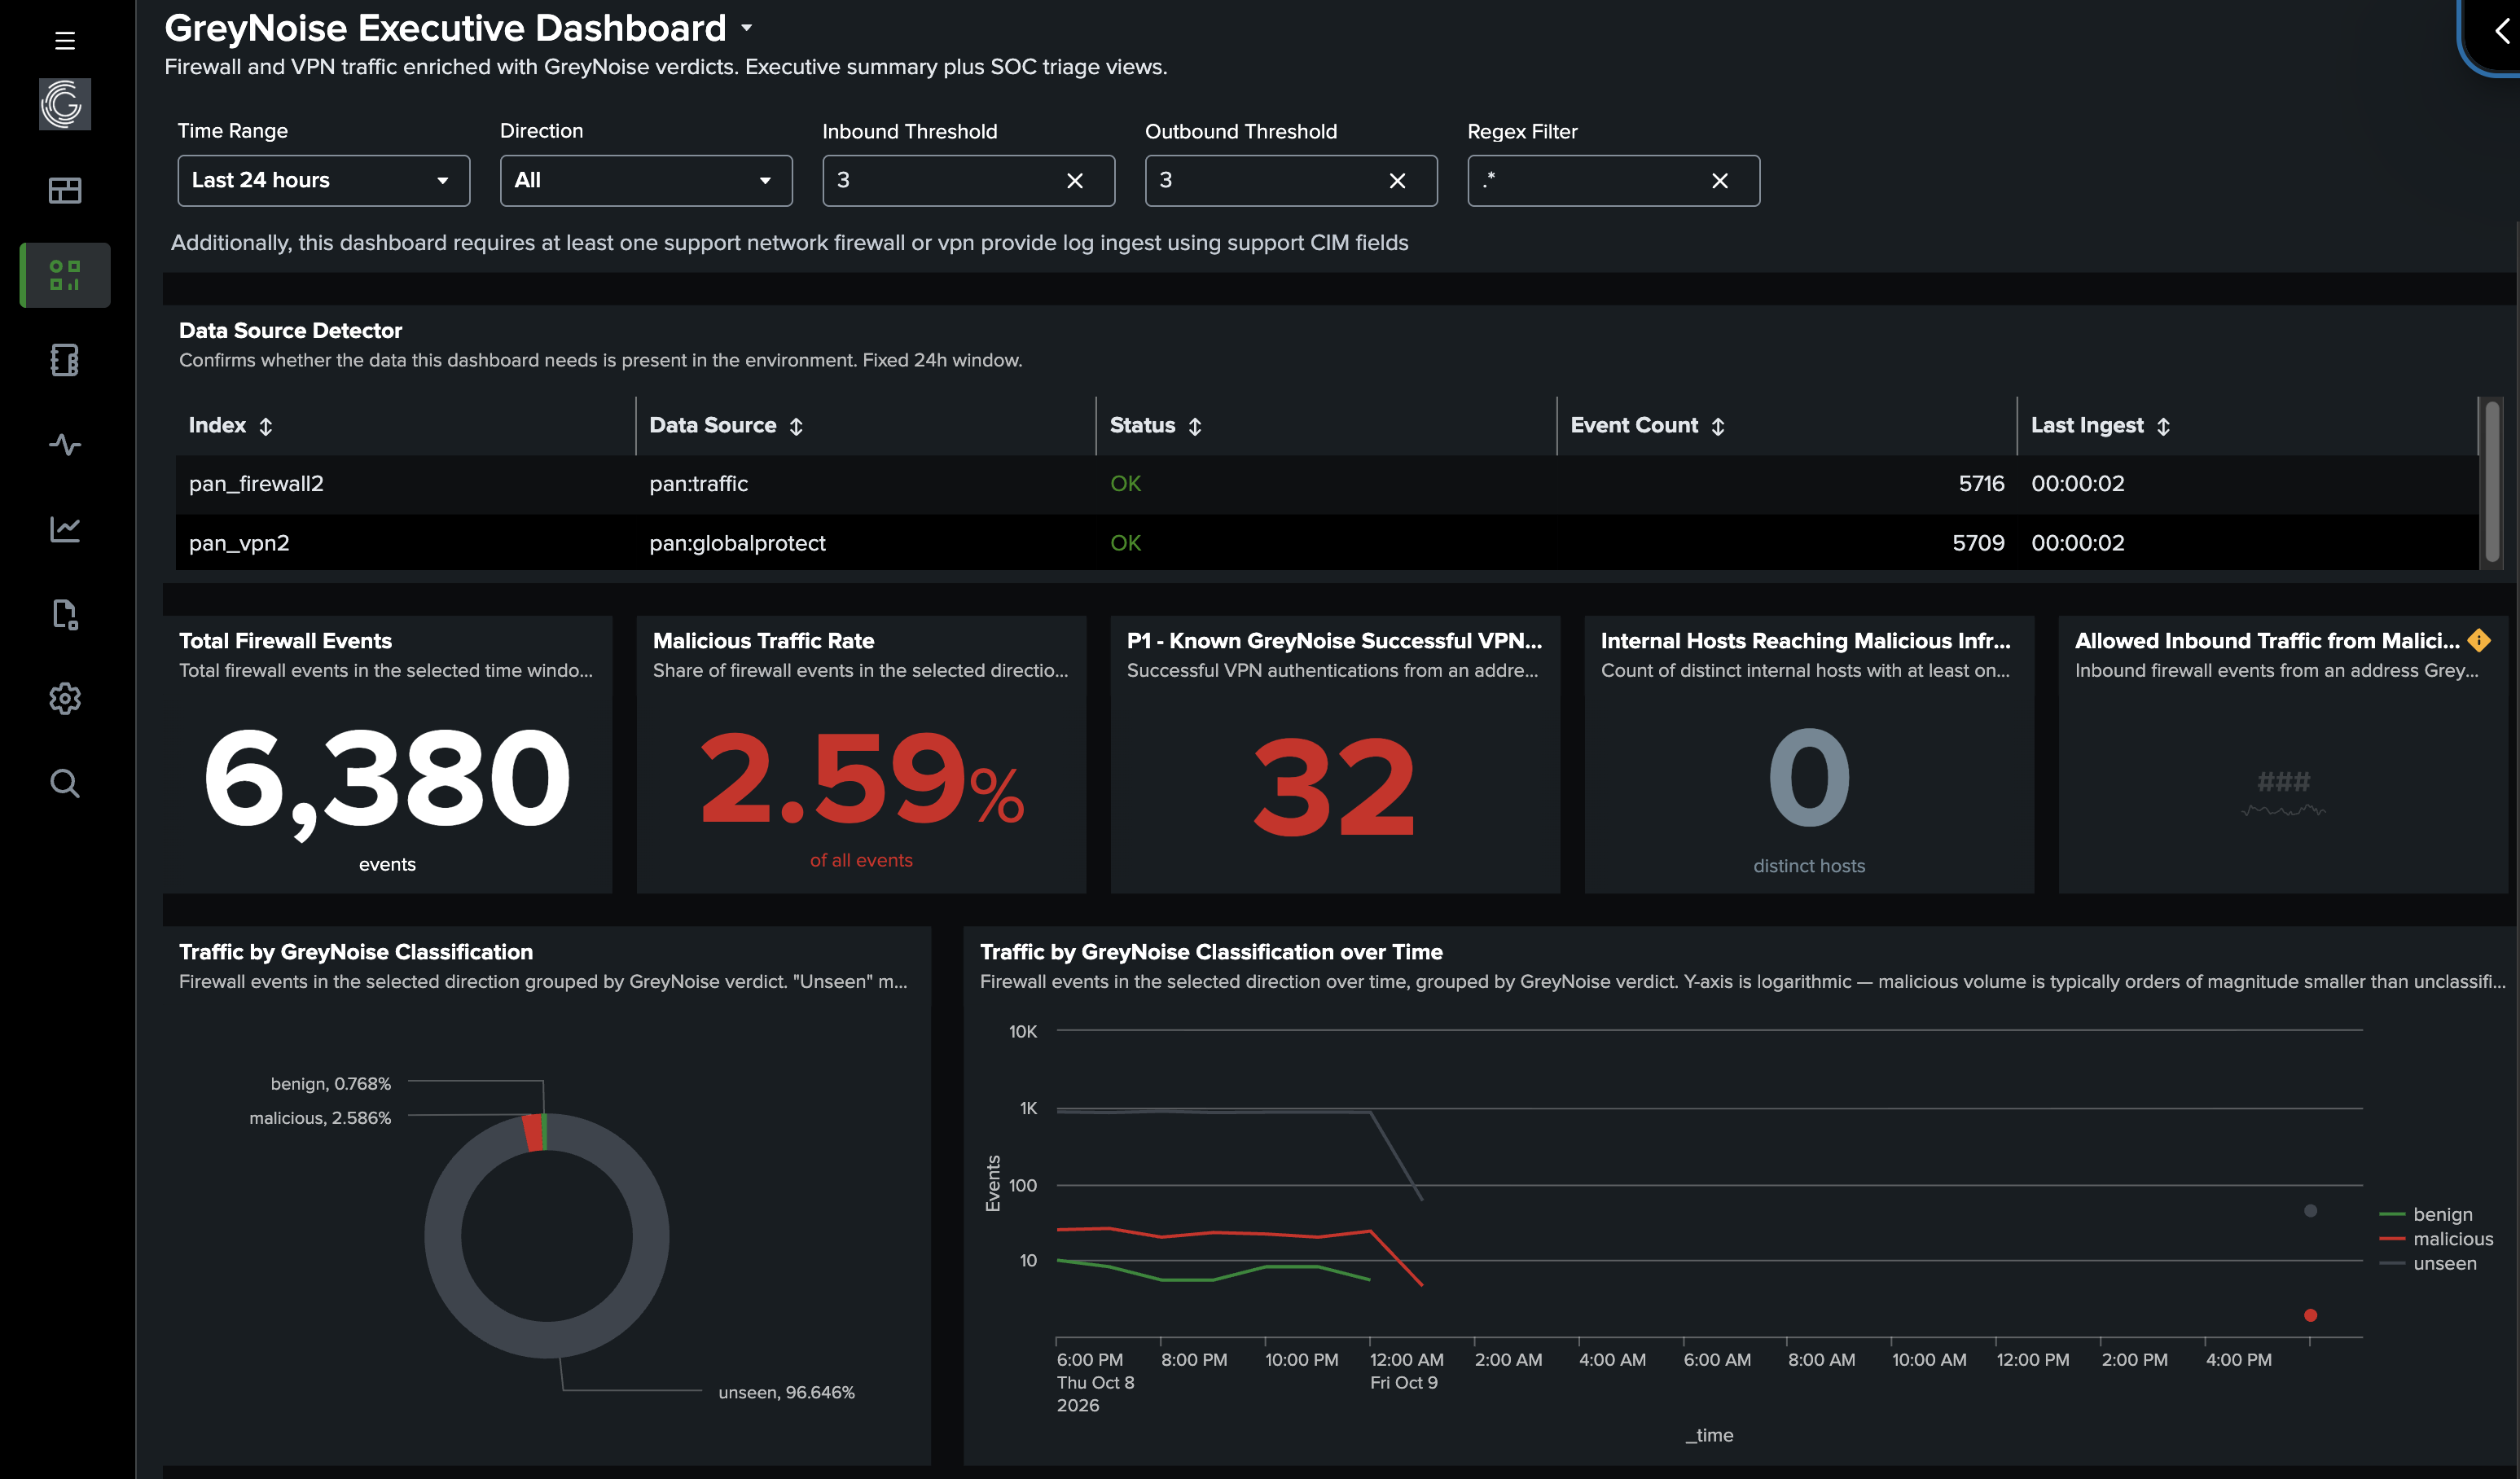
The dashboard reads a local copy of GreyNoise indicators. Each panel looks up the external address in the greynoise_indicators KV store that the Feed import maintains.
Prerequisites
Confirm the following before opening the dashboard:
Tools and Access
| Prerequisites | Details |
|---|---|
| Splunk | Splunk Enterprise or Splunk Cloud — 9.3.x, 9.4.x, 10.0.x, 10.2.x |
| GreyNoise App | GreyNoise App for Splunk 3.1.0 or later, installed from Splunkbase (App ID: 4113) |
| API Key | GreyNoise API key configured under GreyNoise App for Splunk > Configuration |
| Indicator Feed | Feed import enabled, with greynoise_indicators populated |
| Firewall Logs | Logs searchable by the gn_fw_index macro. The default is Palo Alto traffic: index=pan* sourcetype=pan:traffic |
| VPN Logs | Logs searchable by the gn_vpn_index macro. The default is Palo Alto GlobalProtect: index=pan* sourcetype=pan:globalprotect |
| Firewall Fields | src_ip, dest_ip, and action. Volume panels also use bytes_out or bytes |
| VPN Fields | src_ip, plus a status field (status, auth_status, result, or action). The detail table also displays user when it is present |
Setup
Step 1: Enable the Indicator Feed
The dashboard can only classify an address that is already in greynoise_indicators.
Information to set this up can be found in the Installation Guide: Configuring the Feed section.
Step 2: Point the Dashboard at Your Logs
Two macros select the events the dashboard searches for. Both ship pointed at Palo Alto Networks logs.
| Macro | Default search | Used for |
|---|---|---|
gn_fw_index | index=pan* sourcetype=pan:traffic | Firewall panels |
gn_vpn_index | index=pan* sourcetype=pan:globalprotect | VPN panels |
To retarget them:
- Go to Settings > Advanced search > Search macros.
- Set the app context to GreyNoise App for Splunk (SA-GreyNoise).
- Open
gn_fw_indexandgn_vpn_indexand replace the default search with the index and sourcetype that hold your logs.
Example for firewall logs that are not Palo Alto:
index=firewall sourcetype=cisco:asaThe firewall macro gn_fw_scope then decides the direction from src_ip and dest_ip:
| Direction | Rule |
|---|---|
| Inbound | External source, internal destination |
| Outbound | Internal source, external destination |
Internal means RFC1918 (10.0.0.0/8, 172.16.0.0/12, 192.168.0.0/16), IPv6 unique-local (fc00::/7), or link-local (fe80::/10, fec0::/10). Traffic that is internal-to-internal or external-to-external is excluded from the classification, map, and triage panels.
The external address is the one matched by GreyNoise: the source for inbound traffic and the destination for outbound traffic. An event counts as allowed when action is allow, accept, pass, or permit.
If your logs use different field names, add field aliases for src_ip, dest_ip, and action, or edit the gn_fw_scope and gn_vpn_scope macros so they read the names your sourcetype already extracts.
VPN status is taken from the first populated field among status, auth_status, result, and action. Values that match success or allow are treated as a successful login. Values that match fail, denied, or error are treated as a failure.
Step 3: Open the Dashboard and Confirm Data
- Open Apps > GreyNoise App for Splunk.
- Select GreyNoise Executive Dashboard.
The first panel under the introduction is the Data Source Detector. It always searches the last 24 hours, independent of the time-range picker, and lists each index and sourcetype returned by gn_fw_index and gn_vpn_index.
| Column | Meaning |
|---|---|
| Status | OK when that source has events in the last 24 hours. NO DATA when it does not |
| Event Count | Events seen for that index and sourcetype |
| Last Ingest | How long ago the newest event arrived |
NO DATA means the macro is pointed at the wrong index or sourcetype, or those logs have not arrived in the last day. Fix that before reading the panels below it.
Dashboard Controls
The controls at the top apply to the firewall panels. VPN panels always use the full VPN sourcetype for the selected time range.
| Control | Default | Effect |
|---|---|---|
| Time Range | Last 24 hours | Window for every panel except Data Source Detector |
| Direction | All | Limits firewall panels to Inbound, Outbound, or both |
| Inbound Threshold | 3 | Minimum allowed inbound connections before a malicious source appears in Top Malicious Sources Allowed Inbound |
| Outbound Threshold | 3 | Minimum connections before an internal host appears in Internal Hosts Contacting Malicious Infrastructure |
| Regex Filter | .* | Applied to _raw on Malicious Traffic — Event Detail. Narrow this when that table is too broad |
Reading the Dashboard
Executive Summary
These five values sit on one row. Counts turn amber or red once they leave zero, except Malicious Traffic Rate, which uses the thresholds below.
| Panel | What it counts |
|---|---|
| Total Firewall Events | Firewall events in the selected time range and direction. With Direction set to All, this count includes internal and transit traffic. The classification panels below it count inbound and outbound traffic only, so the total can be larger than the pie chart. |
| Malicious Traffic Rate | Share of inbound and outbound firewall events whose external address is classified malicious. Addresses with no feed record stay in the denominator. Green is under 0.1%. Amber is 0.1% up to 1%. Red is 1% or higher. |
| P1 - Known GreyNoise Successful VPN Logins | Successful VPN authentications whose source address is present in greynoise_indicators. Any stored classification counts: malicious, suspicious, benign, or unknown. The value is red when it is 1 or higher. |
| Internal Hosts Reaching Malicious Infrastructure | Distinct internal hosts with at least one outbound connection to a destination classified malicious. Outbound contact is the stronger signal on this dashboard: the host inside the network initiated the connection. |
| Allowed Inbound Traffic from Malicious Sources | Inbound firewall events from a malicious address where the firewall action was allow, accept, pass, or permit. These are sessions that reached an internal asset. |
Traffic Composition
Traffic by GreyNoise Classification is a donut of inbound and outbound firewall events, using the Direction control.
| Classification | Meaning on this dashboard |
|---|---|
| malicious | External address is in the feed with classification malicious |
| suspicious | External address is in the feed with classification suspicious |
| benign | External address is in the feed with classification benign |
| unknown | External address is in the feed and GreyNoise has not assigned a stronger classification |
| unseen | External address is absent from greynoise_indicators |
Traffic by GreyNoise Classification over Time is the same breakdown as an hourly line chart. The Y-axis is logarithmic, because malicious volume is usually far smaller than unseen traffic. Read the slope, not the height, when comparing classifications.
This timeline is the heaviest panel on the page. It looks up GreyNoise for each address in each hour. If it is slow, shorten the time range.
Where the Malicious Traffic Comes From
These panels keep only events whose external address is classified malicious.
| Panel | How to read it |
|---|---|
| Geographic Distribution of Malicious Traffic | Choropleth of the country GreyNoise records for the malicious address. On inbound traffic that is the source country. On outbound traffic it is the destination country. The country is the network registration, which can differ from where the operator is sitting. |
| Top Countries for Malicious Traffic | The same country field as a donut, limited to the top 20. |
| Malicious Traffic by Organization & ASN | Event counts grouped by the organization and ASN on the indicator. Use this to see whether volume is spread across many networks or concentrated in a few. |
VPN Authentication
VPN panels use gn_vpn_index and the same indicator lookup. They ignore the Direction, threshold, and regex controls. The panel titles say GlobalProtect because that is the default sourcetype. After you retarget gn_vpn_index, the same panels show whatever VPN logs that macro returns.
GlobalProtect VPN Logins by Severity assigns each authentication attempt a tier:
| Severity | Rule |
|---|---|
| P1 (GreyNoise IP, Success) | Login succeeded, and the source address is in the indicator feed |
| P2 (Unknown Source, Failure) | Login failed, and the source address is absent from the feed |
| P3 (GreyNoise IP, Failure) | Login failed, and the source address is in the feed |
A successful login from an address that is absent from the feed is not given a tier.
GlobalProtect VPN — Successful Logins from Malicious Sources lists the P1 events: time, source IP, user, GreyNoise actor, ASN, and country. The title on the panel refers to GreyNoise sources in the feed. Click a row to open that IP in the GreyNoise Visualizer.
Treat every P1 row as a completed login from infrastructure GreyNoise has already observed. Confirm the account, the source address, and whether that login was expected.
SOC Triage Tables
| Panel | What it shows |
|---|---|
| Top Malicious Sources Allowed Inbound | Malicious sources whose allowed inbound connections meet the Inbound Threshold. Columns are source IP, attribution (actor when GreyNoise has one, otherwise ASN), last_seen, connection count, and the internal hosts that were reached. Click a row to open the source in the GreyNoise Visualizer. |
| Internal Hosts Contacting Malicious Infrastructure | Internal hosts whose outbound connections to malicious destinations meet the Outbound Threshold. Columns are the host, connection count, volume in megabytes, and the destination IPs. Repeated contact from one host is a reason to investigate that host for compromise. |
| Malicious Traffic — Event Detail | One row per firewall event whose external address is malicious, in the selected direction. Columns include time, the GreyNoise IP, actor, ASN, spoofable flag, source and destination IP and port, translated addresses, bytes, and firewall action. Click a row to open the GreyNoise IP in the Visualizer. |
The event detail table is a recent sample. The search keeps the newest 20,000 firewall events in the time range, keeps the malicious matches, applies the Regex Filter, and displays at most 1,000 rows. Use a shorter time range or a tighter regex when you need a specific slice of that activity.
Understanding the Output
Work the page from the summary row down.
- Data Source Detector should show OK for the firewall sourcetype, and for the VPN sourcetype if you use those panels. A feed that has not yet run leaves every address unseen, and the malicious panels remain at zero.
- Malicious Traffic Rate answers how much of the perimeter traffic GreyNoise currently classifies as malicious. A low rate is normal. The number is the share of events, so a handful of allowed malicious sessions can still matter when the rate looks small.
- P1 VPN logins and Allowed Inbound Traffic from Malicious Sources are the two outcomes that already crossed a control: a login completed, or the firewall allowed the session.
- Internal Hosts Reaching Malicious Infrastructure flips the view. These are assets inside the network, opening connections to destinations in the malicious feed.
- The organization, country, and event-detail panels explain who those addresses are. Actor, ASN, and the Visualizer link are the handoff into the investigation.
Raising the Inbound or Outbound Threshold hides one-off connections and keeps hosts and sources with repeated contact visible. Lower them when you want the first occurrence.
Benefits for the SOC Team
- One page for leadership and triage. Volume, classification mix, and the highest-severity outcomes are on the same dashboard as the IP, host, and account details an analyst needs next.
- No per-panel API lookups. Verdicts come from the feed lookup, so analysts can change the time range and filters without spending API quota.
- Allowed traffic is separated from blocked scanning. The allowed-inbound count and the top-sources table are limited to sessions that the firewall accepted from a malicious address.
- Outbound contact is called independently. Internal hosts talking to malicious destinations are counted and listed separately from inbound scanning.
- VPN successes from known GreyNoise addresses are a single number. P1 is the count of completed logins whose source is already in the indicator feed, with the account and source on the row beneath it.
Conclusion
The Executive Dashboard is the record view of how GreyNoise classifications align with firewall and VPN activity already in Splunk. Once the feed imports all indicator classifications and the two index macros point to your logs, the summary row shows whether malicious traffic is reaching assets or leaving the network, and the tables below list the addresses, hosts, and accounts involved.
The following use case guides turn those same questions into scheduled detections.
Updated 11 days ago