
Using the GreyNoise Visualizer 2.0
The new GreyNoise Visualizer is a redesign of the Visualizer at viz.greynoise.io, built around a left sidebar that groups the product into Intelligence, Observation, and Automation. Everything available in the Classic Visualizer is still present, though several features that were separate pages have been folded into the surfaces they belong to.
Switching Between the Classic and New Visualizer
Both versions are served from viz.greynoise.io, and the version you receive is set by a preference on your GreyNoise account. You must be logged in to change it.
From the Classic Visualizer, click Try the New Visualizer in the upper right of the header, next to the account menu. The same button is in the mobile navigation menu.

To go back, click Classic in the upper right of the new Visualizer header.

Either button reloads the application. The preference can also be set under Account Settings in the App Version field. See Changing Your Account Settings.
The choice is saved to your account rather than to a browser, so it applies on any device you log in from.
Navigating the New Visualizer
Navigation lives in a collapsible sidebar on the left rather than in dropdown menus across the top. The sidebar is organized into three sections, with Dashboard above them and Experiments and Threat Briefs below.
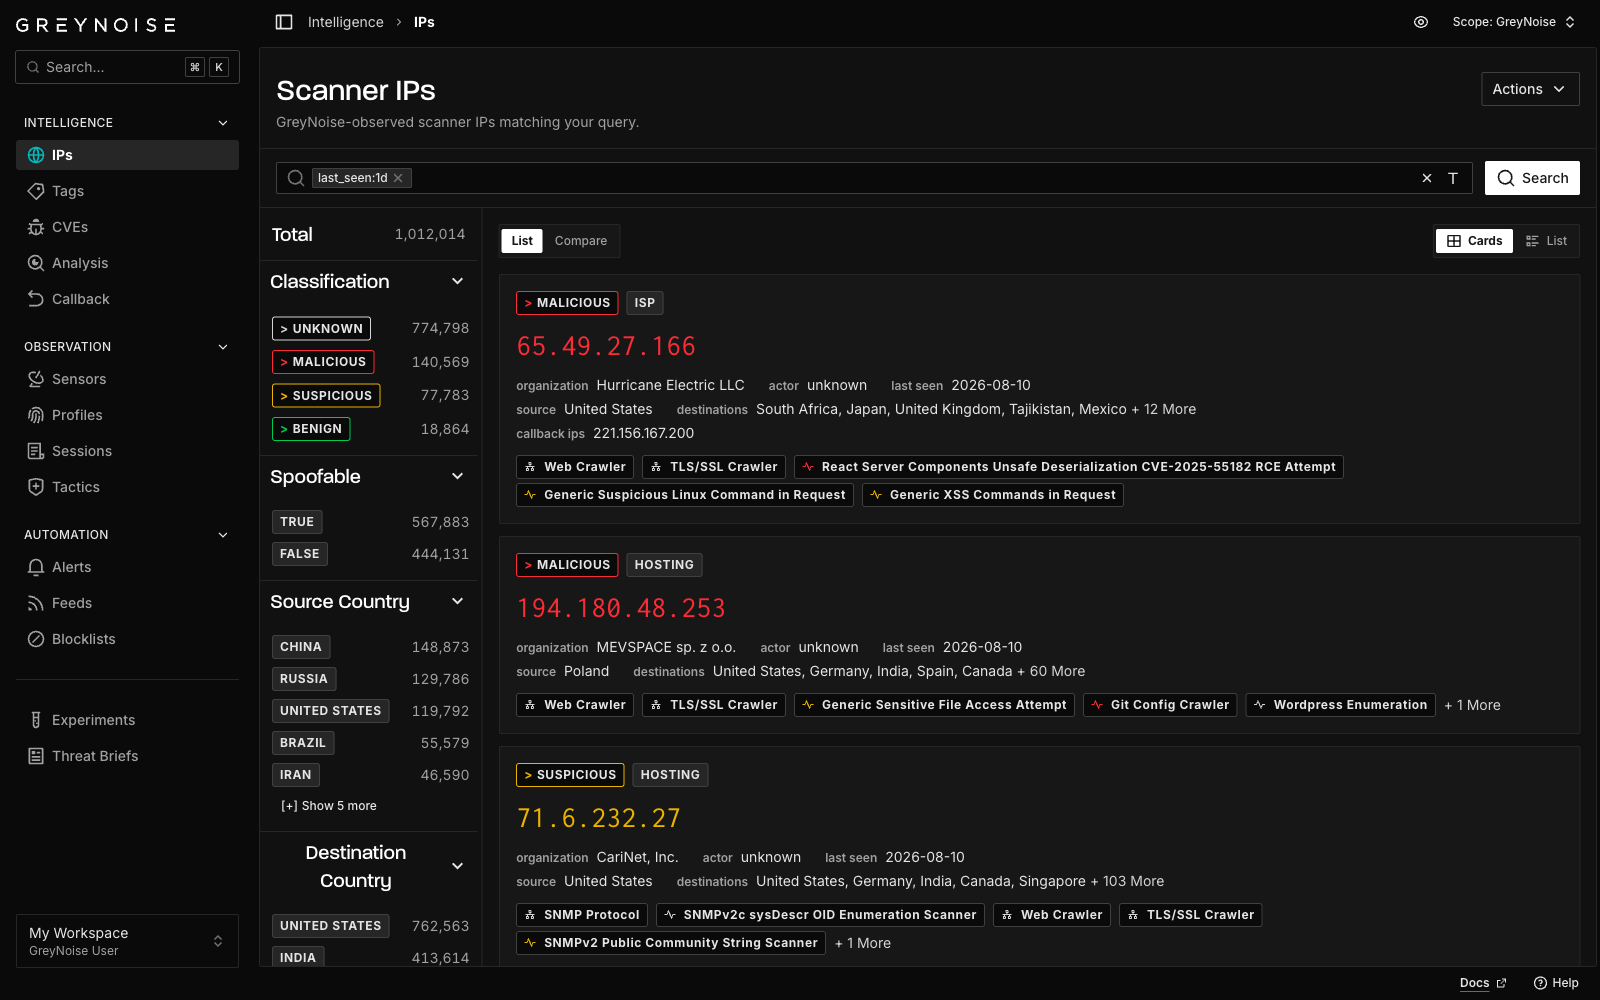
| Section | Items |
|---|---|
| Intelligence | IPs, Tags, CVEs, Business Services, Analysis, Callback |
| Observation | Get Started, Sensors, Profiles, Sessions, Tactics |
| Automation | Alerts, Feeds, Blocklists |
Use the toggle at the left of the header to collapse the sidebar and give a table or chart the full width of the window. Breadcrumbs in the header show the current location, and each crumb is a link back up the hierarchy.
Sidebar items appear based on the plan and modules attached to a workspace, so a given sidebar may be shorter than the one shown above. See Feature Availability.
Searching
Click the search control at the top of the sidebar, press ⌘ K, or use the search button on the Visualizer home page to open the Search dialog from anywhere in the application. The dialog searches one dataset at a time, selected with the picker at its left: IPs, Callback, CVEs, or Tags.
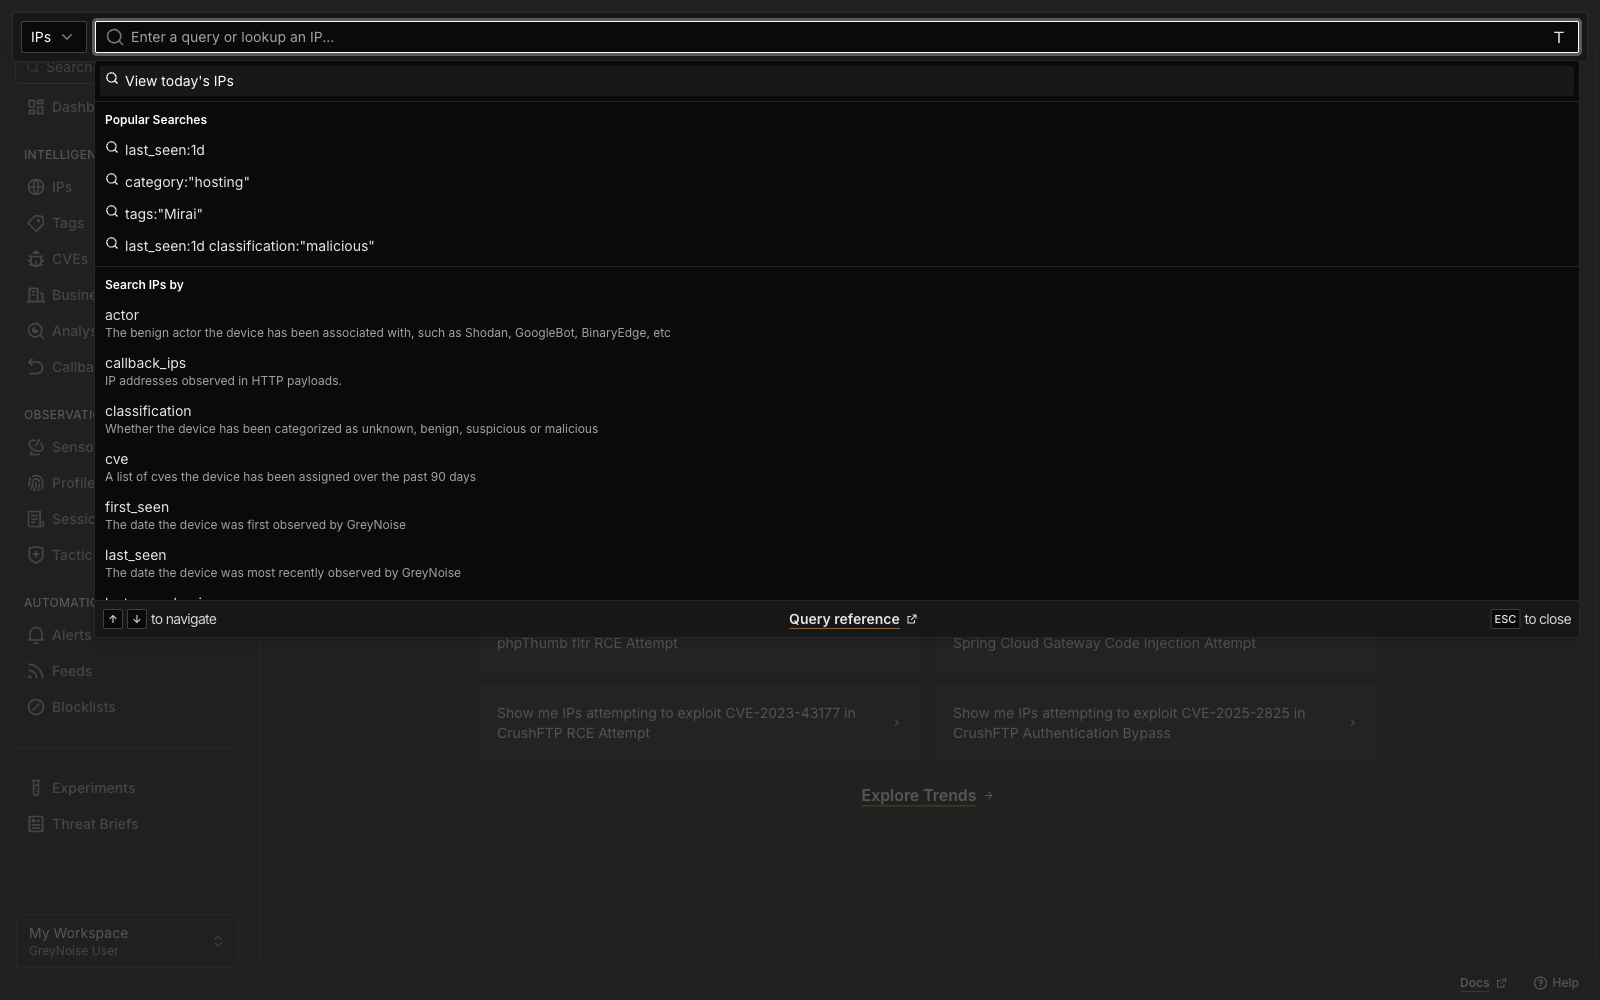
Before anything is typed, the dialog offers Popular Searches to run as-is and a Search IPs by list of every searchable field with a description of what it holds. Typing filters that list, so the dialog doubles as a field reference while a query is built.
Header Controls
Three controls sit at the right of the header and appear only where they apply.
Scope selects which sensor network supplies the data on the current page, and more than one can be selected at once. It appears on IPs, IP details, Tag details, CVE details, Callback, and Dashboard.
| Scope | Data |
|---|---|
| GreyNoise | Data collected by GreyNoise sensors across the internet |
| Community | Data collected by community-deployed sensors |
| My Workspace | Data from sensors deployed in your workspace |
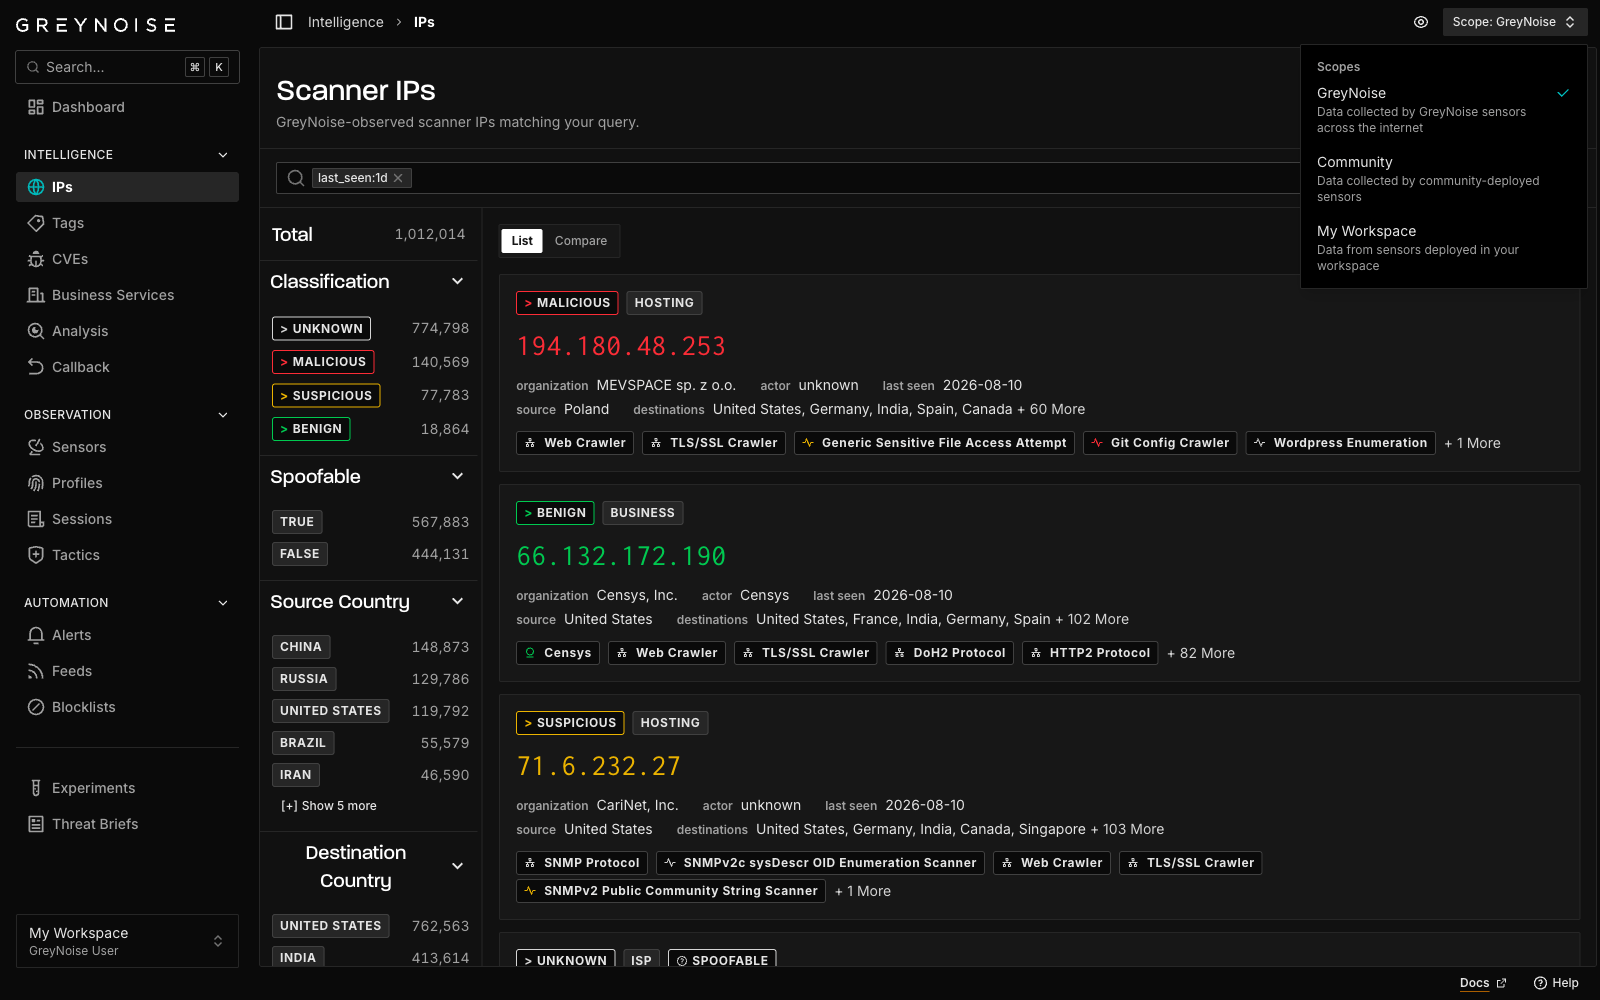
Community and My Workspace require the community dataset. Without it, both options are shown but disabled, with a prompt to deploy a sensor.
Redact sensitive data masks sensor and destination IPs so a screen can be shared safely. Click a masked value to reveal it, or use the header toggle to reveal the whole page. The default is set in Account Settings, and the control appears for workspaces with sensors.
Share creates a link that gives another person access to the current page. See Sharing a Page.
Intelligence
Searching for an IP
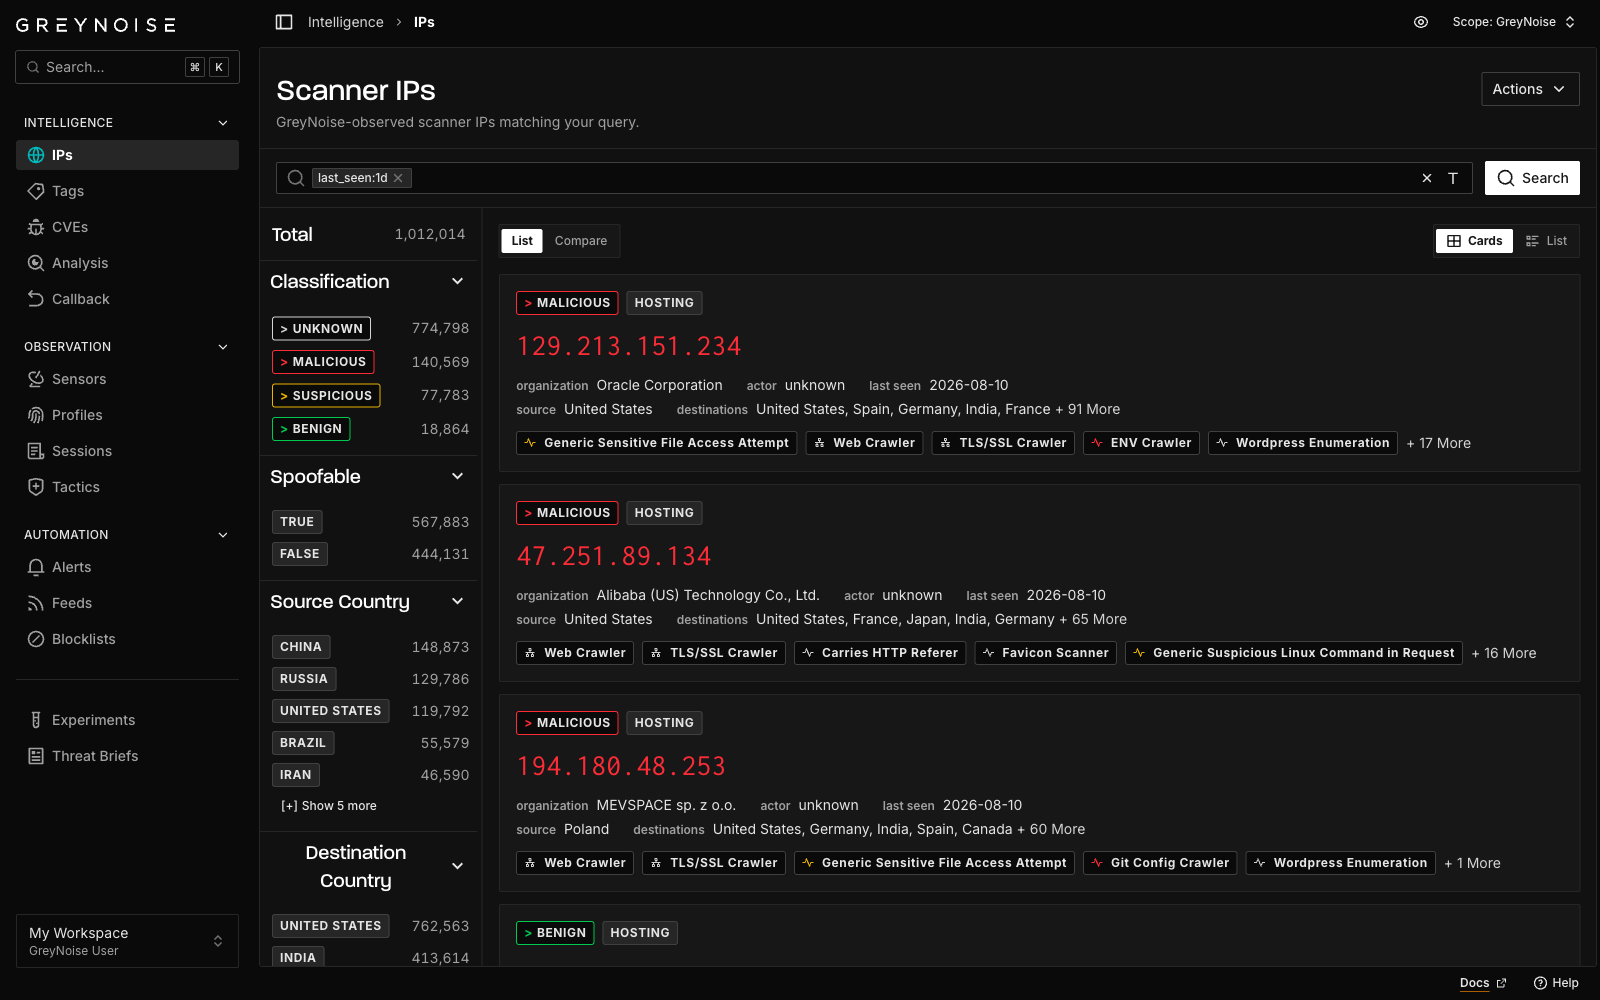
Open the Search dialog, select the IPs dataset, and enter an IP or CIDR block (ex. 59.98.196.0/24) to look up. Selecting a single IP opens its detail page. Entering a query opens the Scanner IPs page, which lists GreyNoise-observed scanner IPs matching that query.
Scanner IPs is also reachable directly from IPs in the sidebar, which opens the page pre-filled with last_seen:1d.
Reviewing the Details of an IP
GreyNoise holds three datasets about an IP: Scanner, Callback, and Business Service. A detail page shows only the datasets that IP appears in, named by a badge under the address. An IP in one dataset opens directly on it; an IP in several opens on the richest and offers the others as tabs.
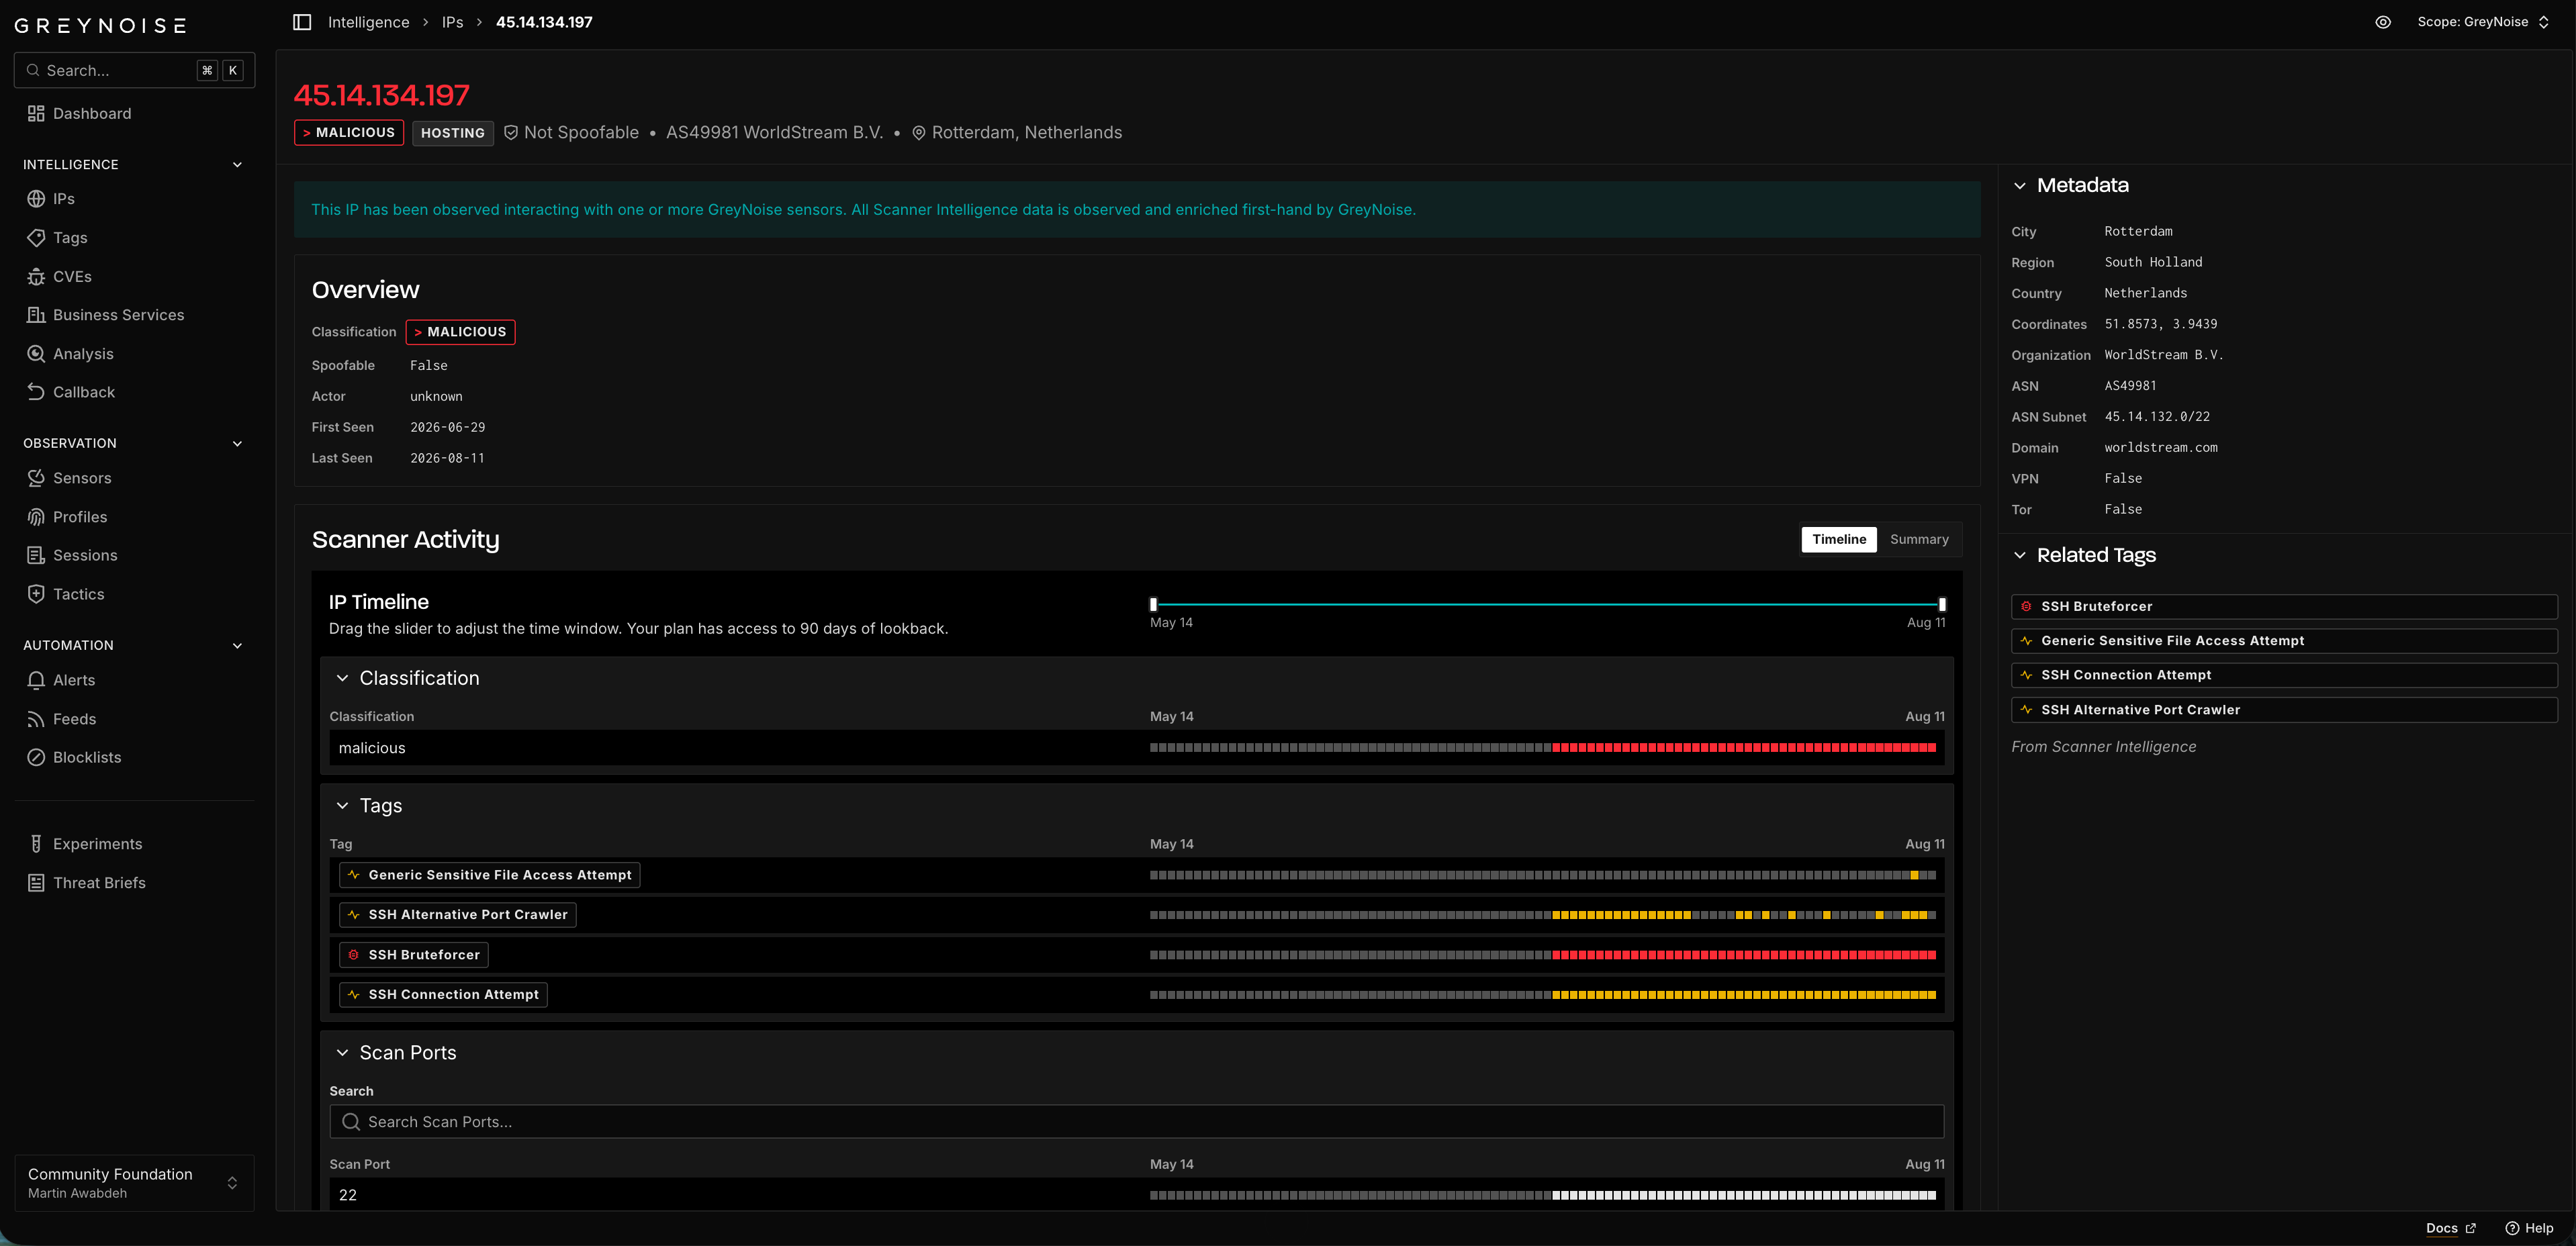
The Scanner dataset covers activity GreyNoise observed from the IP as it scanned the internet: Scanner Activity, Overview, Destinations, Ports, Fingerprints (including HASSH, JA3, and JA4+), Web Requests, and Tag Volume Counts.
The Callback dataset covers the IP as a destination extracted from an exploit payload. It carries an Attack Stage readout of how far the IP has been confirmed along the chain, plus Visualizations and Associated Malware. The Business Service dataset covers the IP as part of a known business service, with its service name, category, and trust level.
34.245.102.249 is an example of an IP in all three datasets, carrying a Scanner, Business Service and Callback IP badge, with a tab for each.
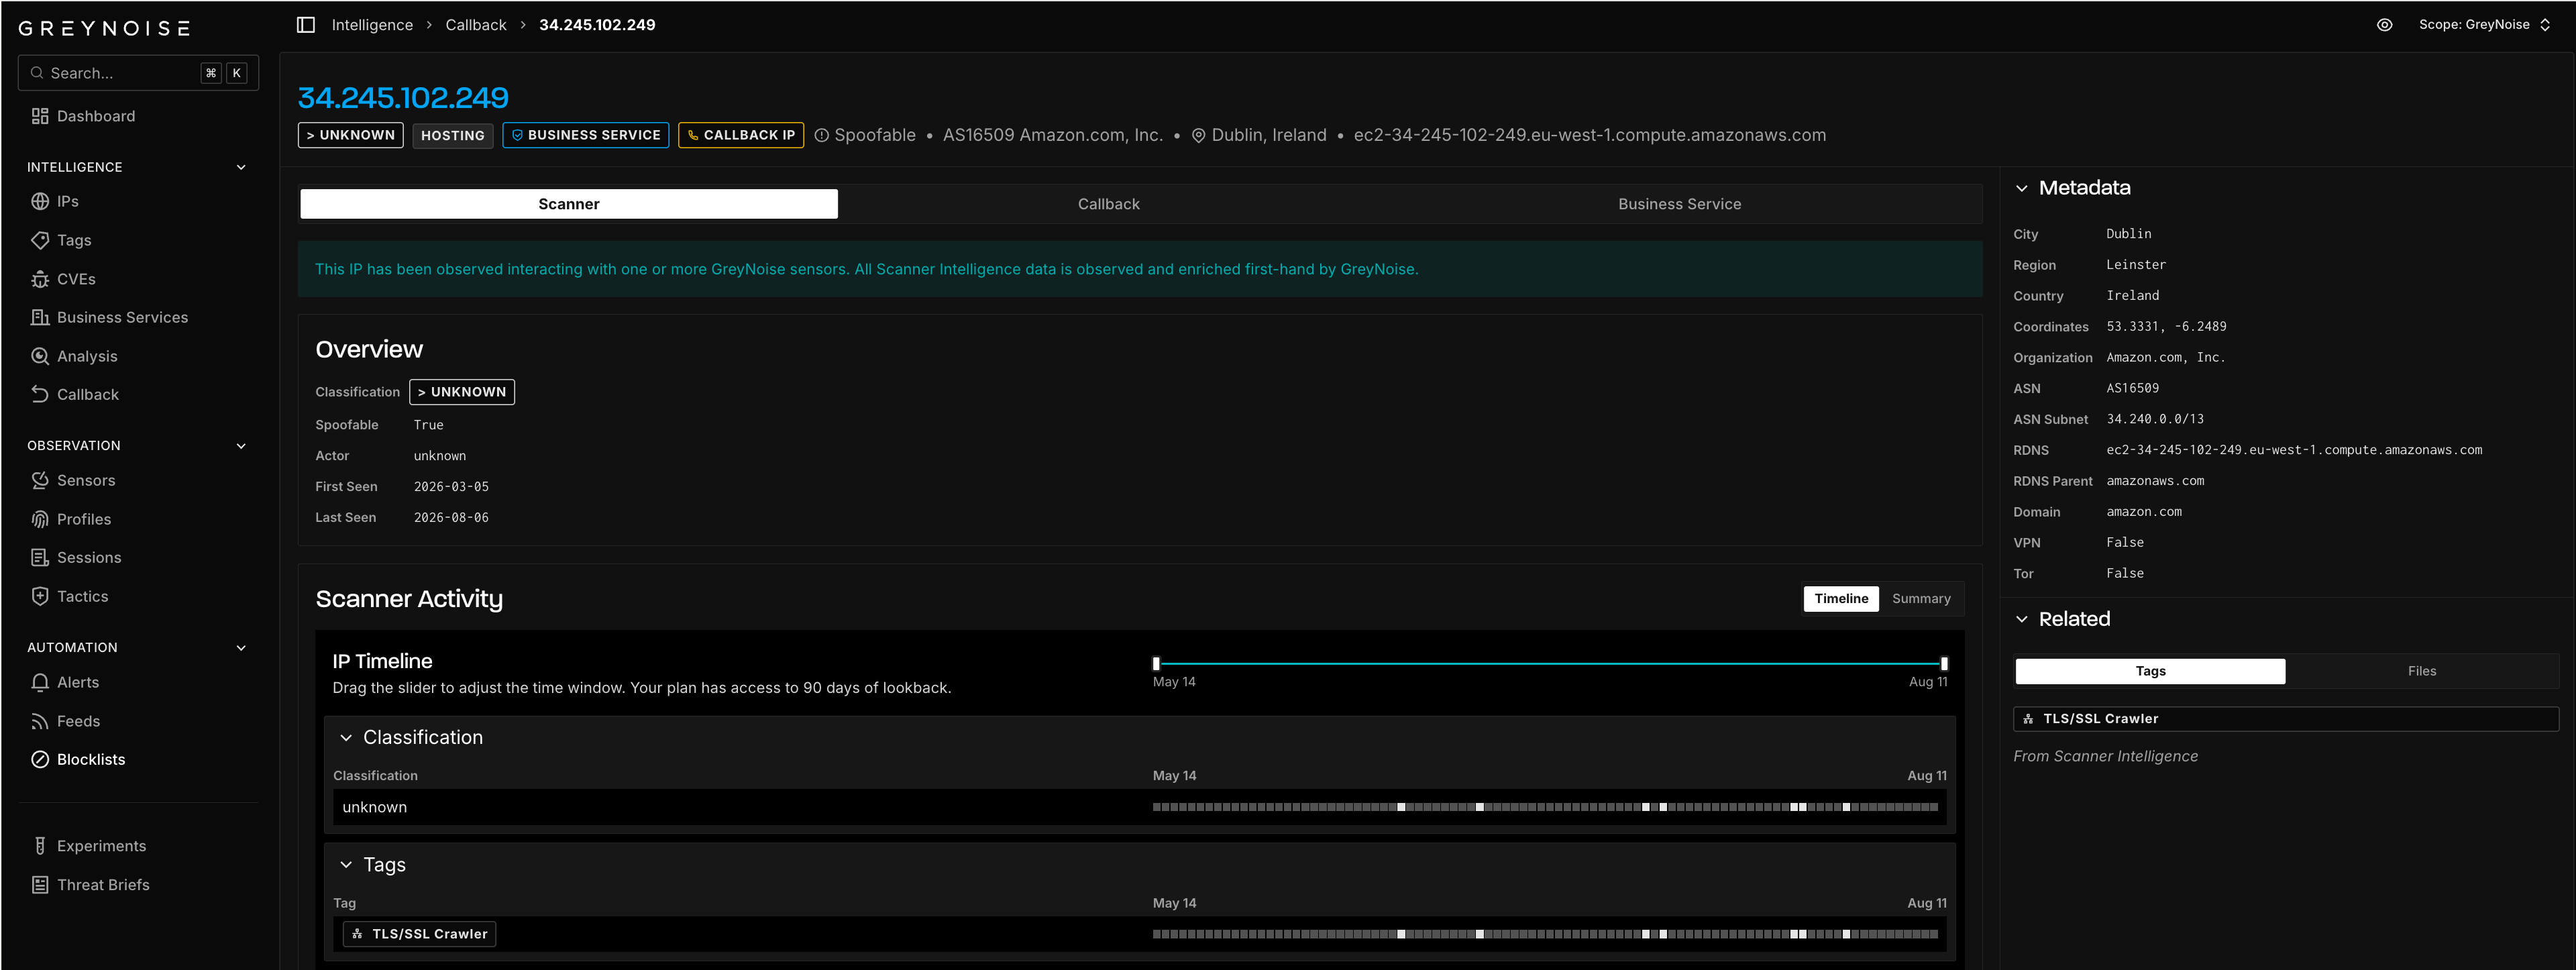
The Metadata sidebar carries the identity of the IP rather than its behavior: First Seen, Last Seen, City, Region, Country, Coordinates, Organization, ASN, RDNS, Domain, VPN, and Tor. Fields vary with what GreyNoise knows about the address. Below it, Related links to the connected tags, CVEs, files, and IPs.
Refining Search Results
Badge Search
The search field renders each term of a query as a badge rather than as raw text. This is the main way to adjust a query in the new Visualizer.

Each badge is one term of the query. Click the ✕ on a badge to drop that term and rerun the search without it. Click the connector between two badges to pivot it between AND and OR. Click the ( ) button to group the current terms in parentheses, and click a parenthesis badge itself to remove the group. The ✕ at the right of the field clears the query entirely.
The button at the right end of the field switches between badge view and raw text view, so a query can always be edited as GNQL directly.
A query too complex to represent as badges opens in raw text view automatically.
To exclude a value, prefix it with a minus sign (ex. -classification:benign). Full query syntax is covered in Using the GreyNoise Query Language (GNQL).
Facets, Views, and Actions
The sidebar on the Scanner IPs page breaks results down by classification, tag, organization, country, and other fields. Selecting a facet value adds it to the query as a new badge.
Results are available in two views. List shows the matching IPs as a table or as cards, with configurable columns and sorting.
Compare runs the same query against two observation sources and reports the difference, so a workspace can see what its own sensors caught that the wider network did not. Pick the source to compare against; the Stats Comparison sidebar totals what is unique to each and what appears in both, and Unique IP Addresses and Unique Values list what only the first source saw.
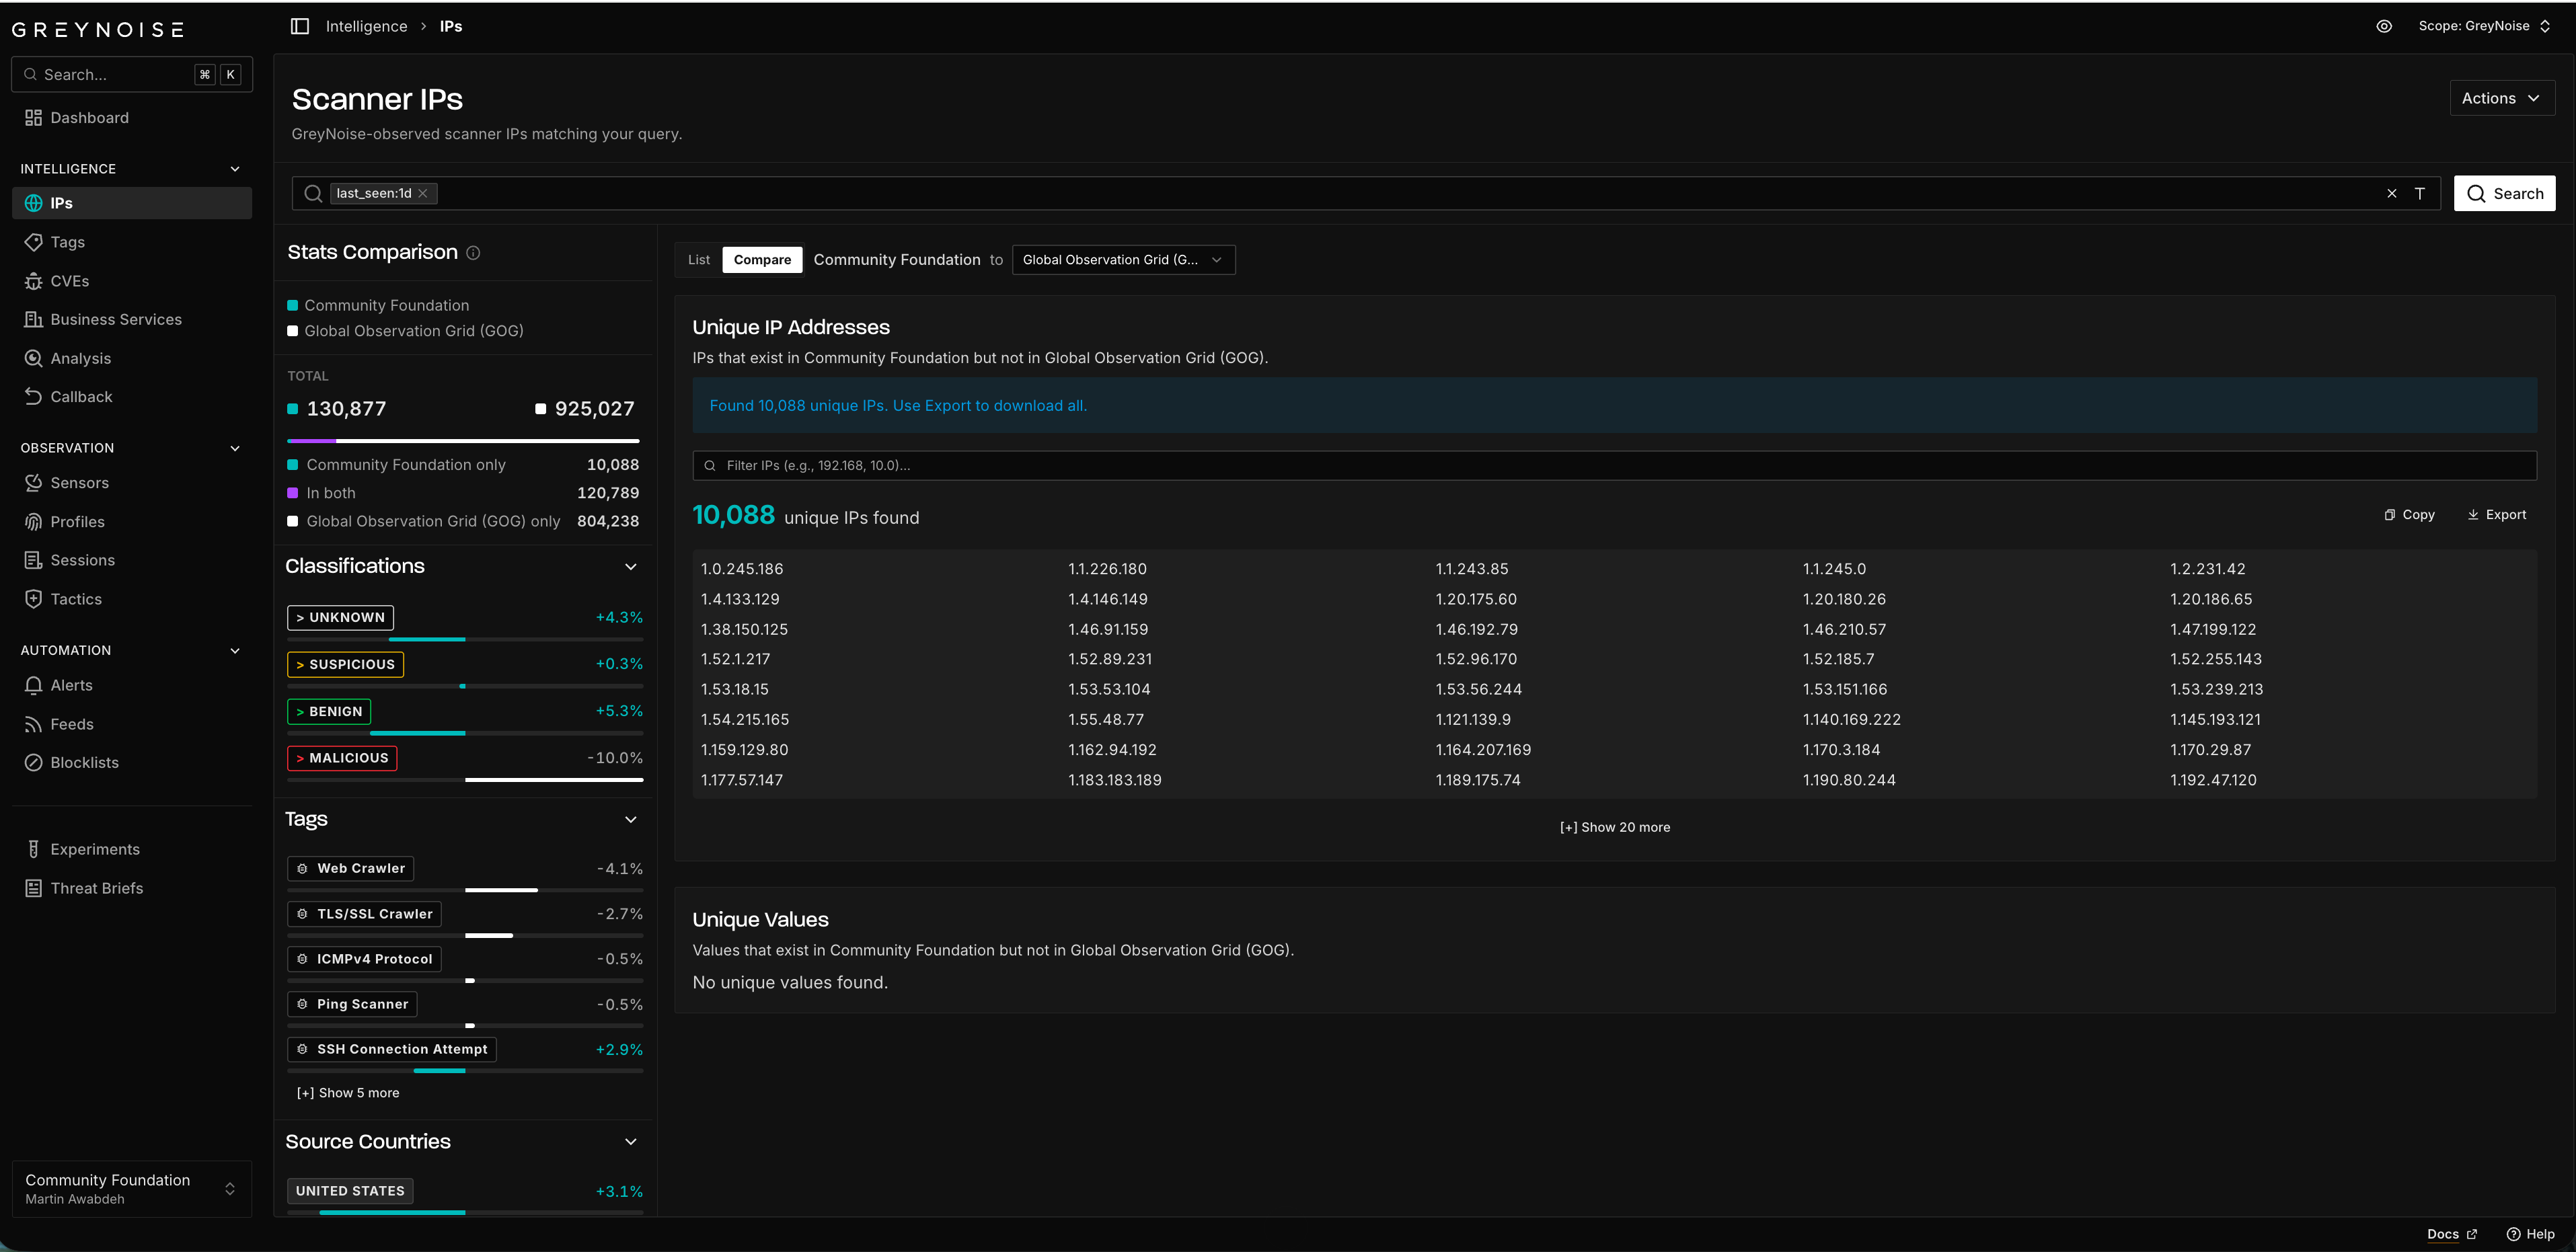
The Actions menu in the page header holds two groups. Automate carries Create Alert and Create Blocklist, each of which opens the corresponding automation pre-filled with the current query. Export downloads the results as JSON or CSV.
Export requires a subscription. Blocklists require the blocklists module.
Browsing Tags
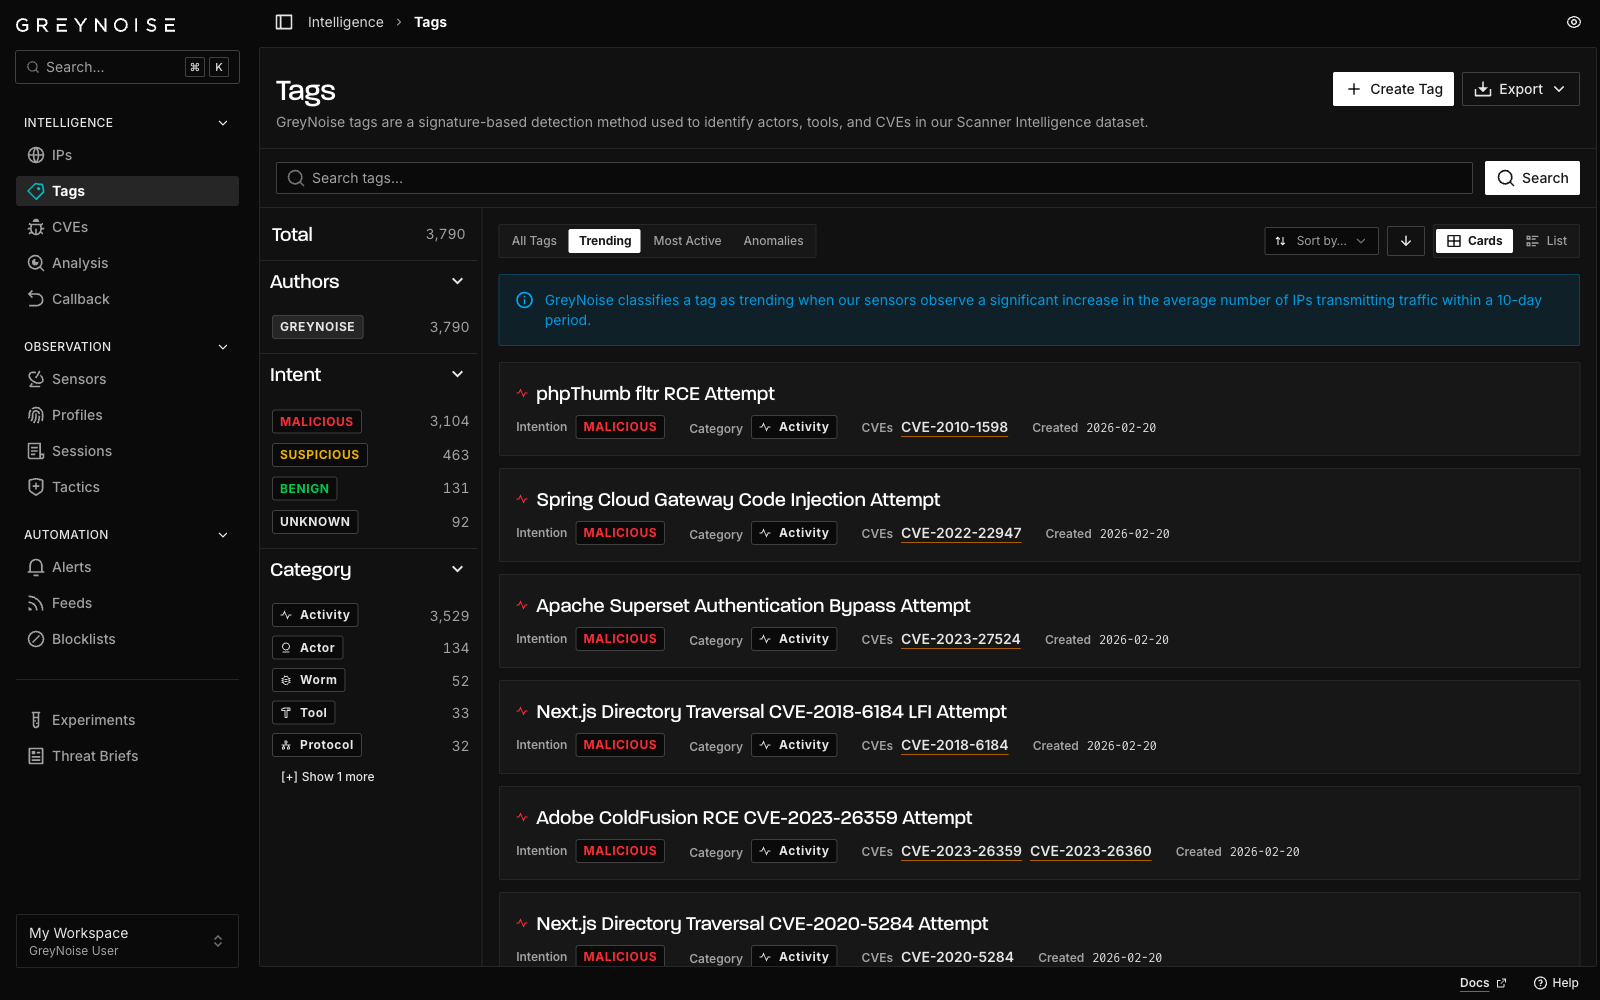
GreyNoise tags are a signature-based detection method used to identify actors, tools, and CVEs in the Scanner Intelligence dataset. The Tags page is the catalog of every tag GreyNoise publishes, plus any custom tags belonging to a workspace.
The catalog offers four views. Tags lists all tags. Trending, Most Active, and Anomalies surface tags by recent behavior, each over its own time window, which is stated in a banner on the view.
A tag detail page shows Scanner Activity, a Timeline, Related entities, and References. Its header carries Create Alert, Block at Firewall, and Export IPs (24hr).
Reviewing a Tracked CVE
The CVEs page lists the CVEs that GreyNoise tracks with a tag. Search the catalog by CVE ID, vendor, or product.
A CVE detail page shows Scanner Activity, a Timeline of exploitation attempts over a selectable time range, Related entities, and Exploitation Stats. Create Alert and Block at Firewall are in the header.
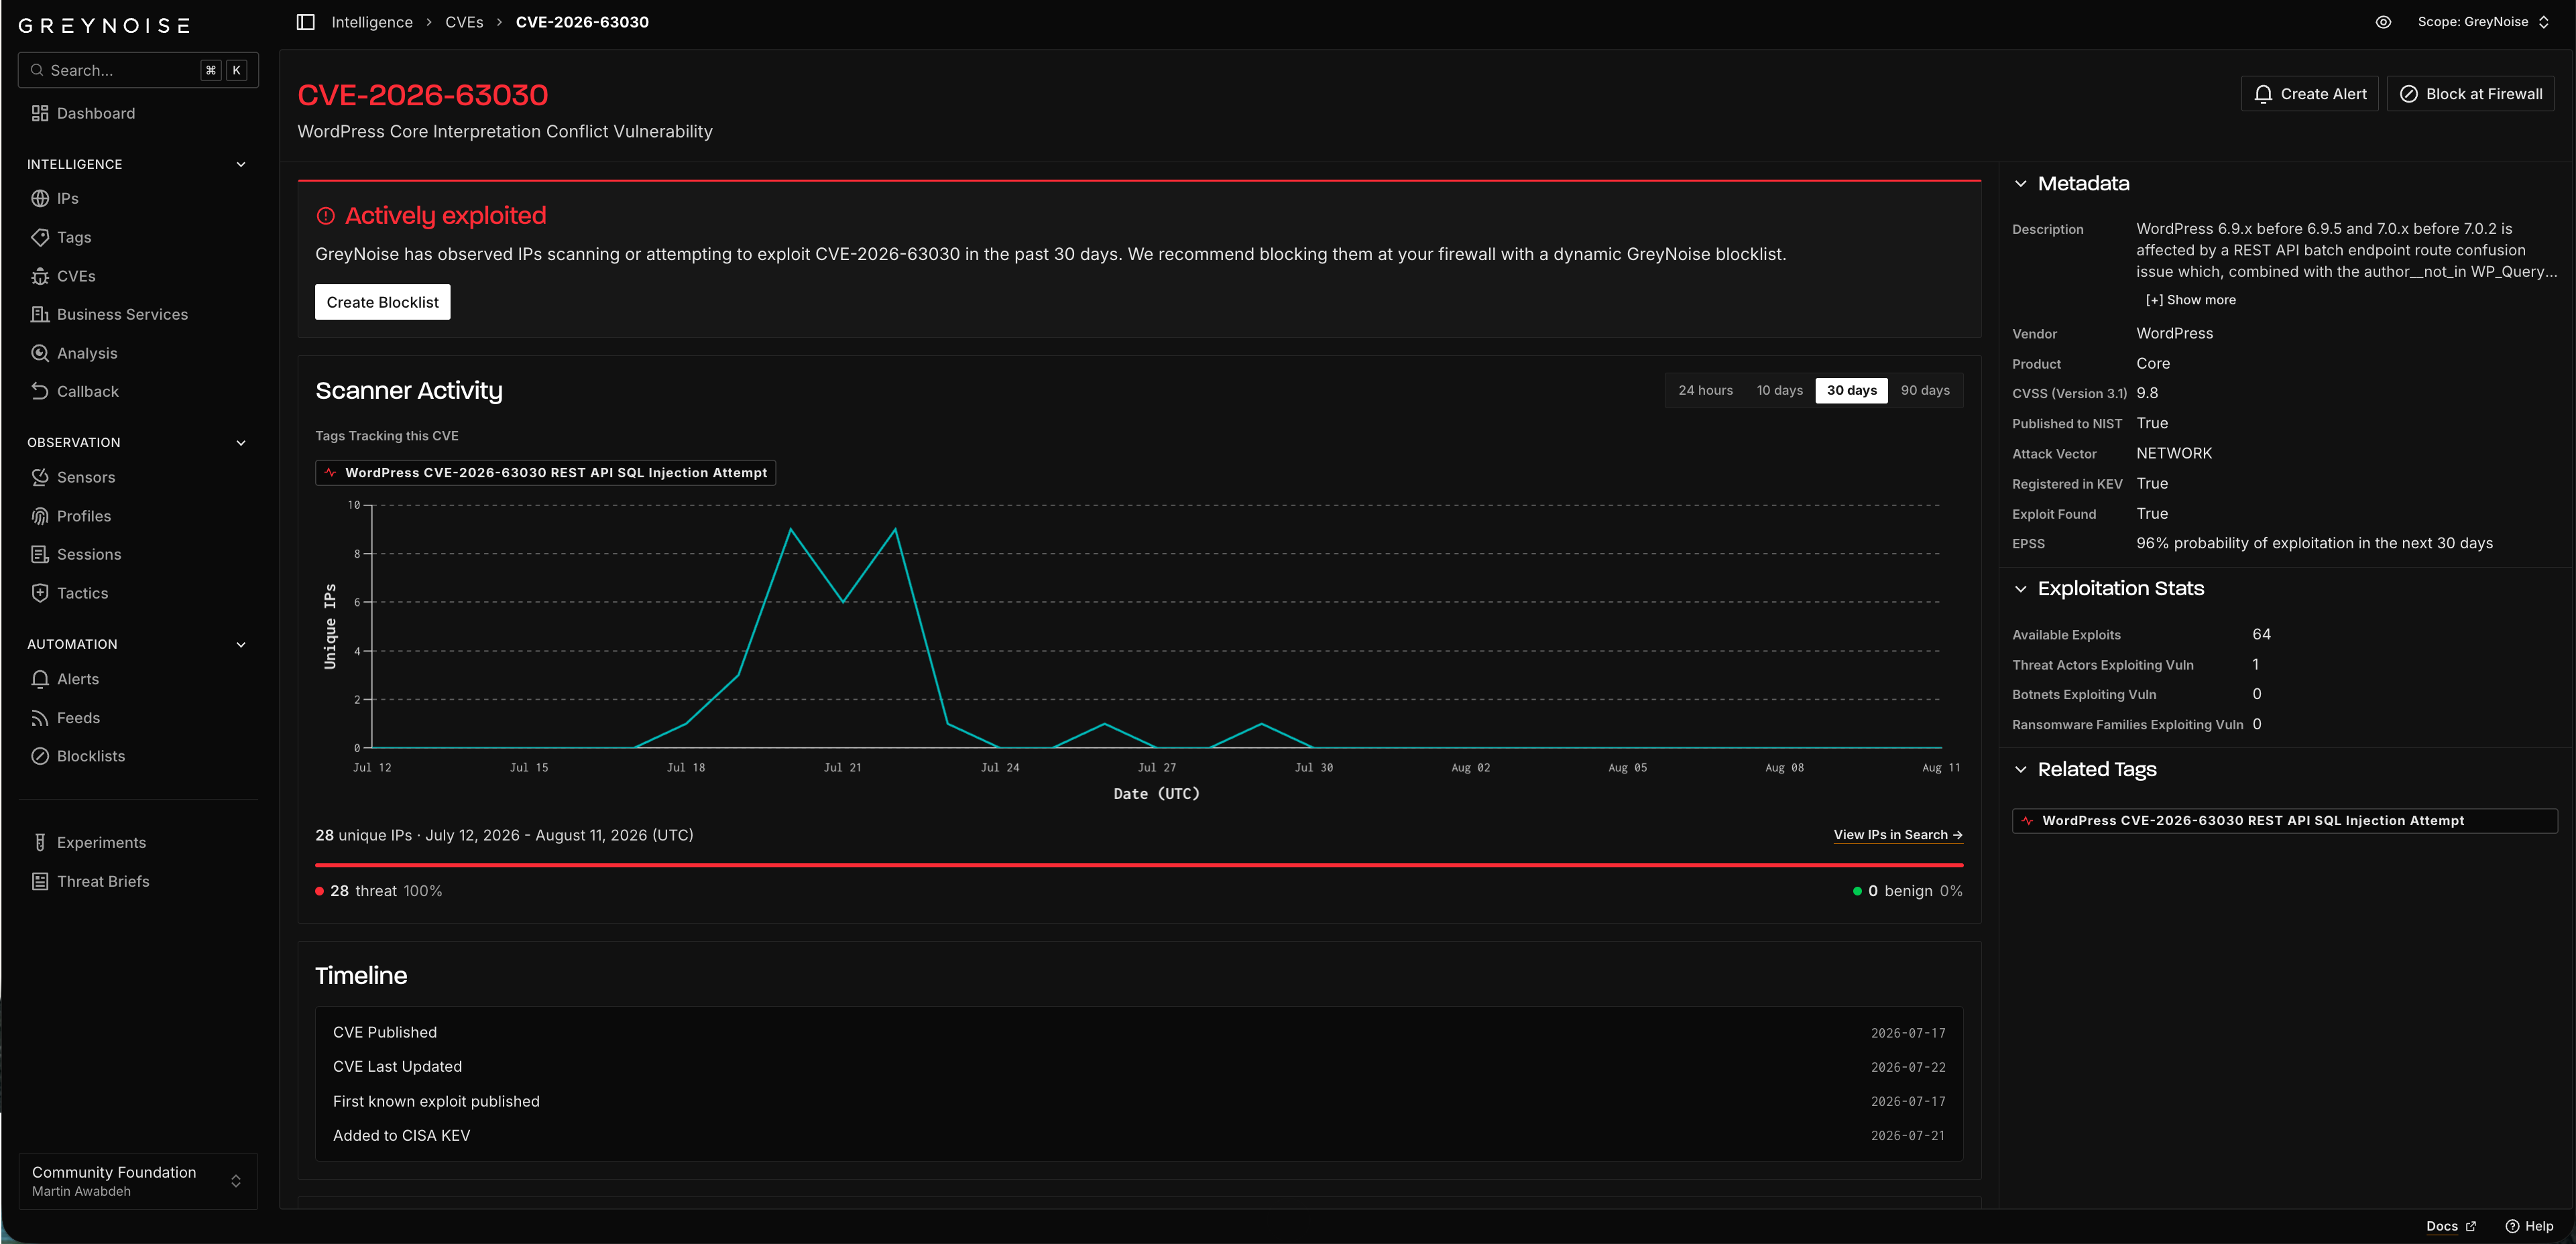
Entering a full CVE ID that GreyNoise does not track surfaces a notice saying so, with a link to view the CVE anyway.
Exploring Business Services
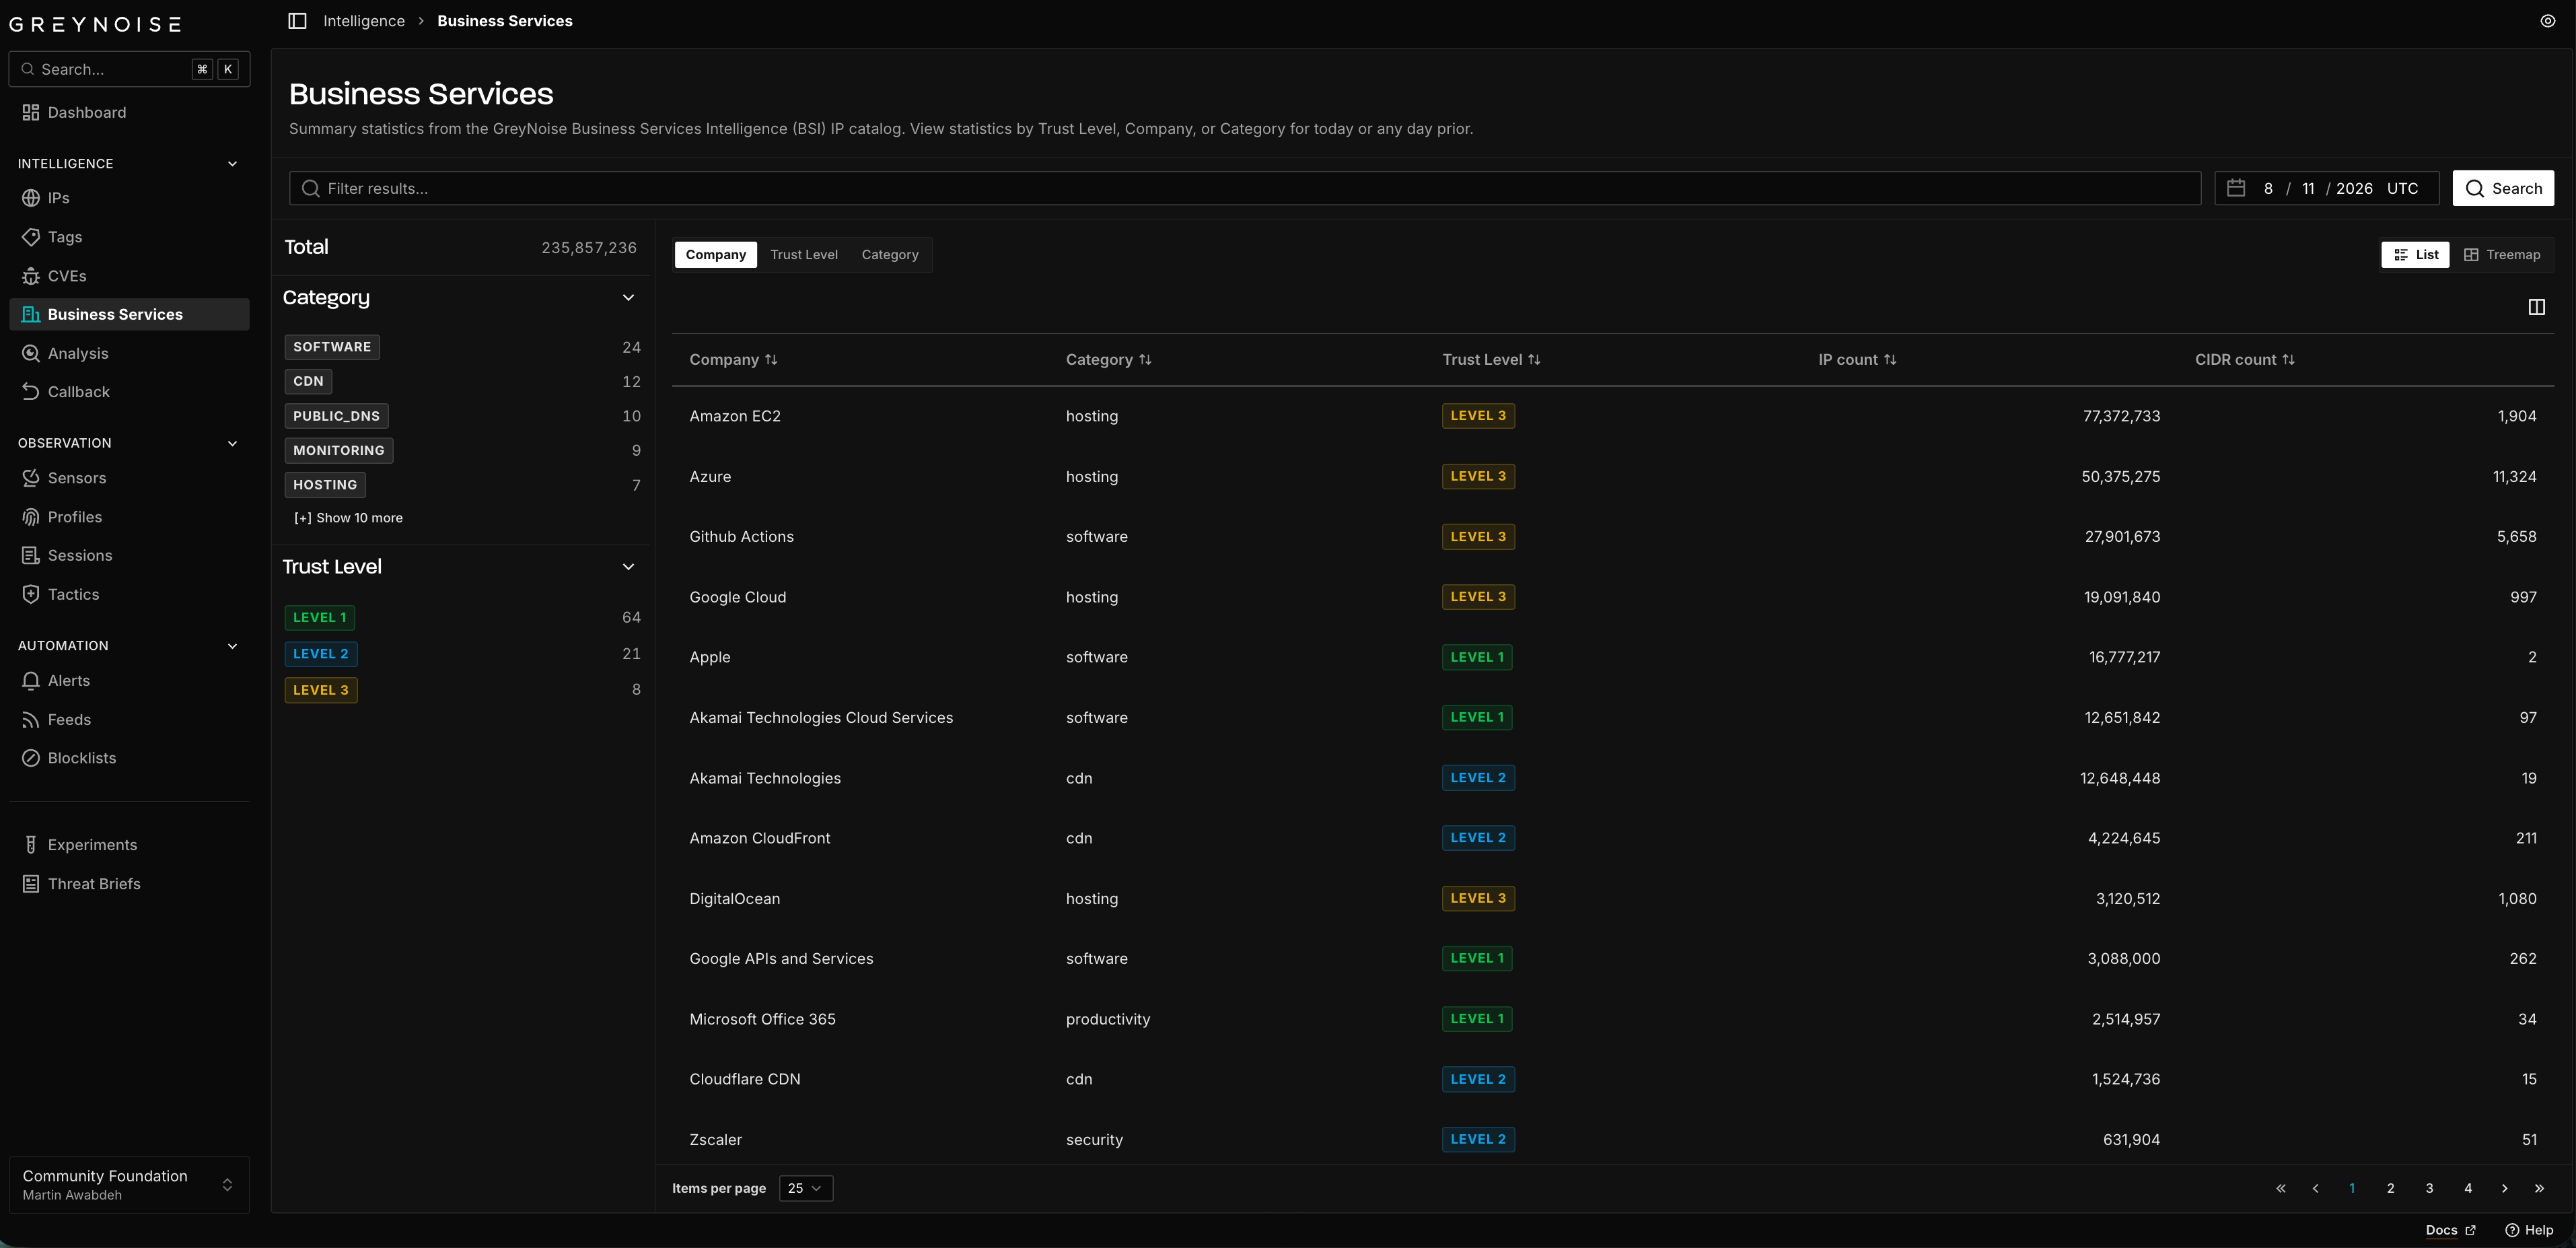
Business Services shows summary statistics from the GreyNoise Business Services Intelligence (BSI) catalog of known-good IPs, formerly called RIOT. View statistics by Trust Level, Company, or Category, for today or for any prior day.
Analyzing a File or List of IPs
The Analysis page enriches IPs or CVEs in bulk, handling both on one page. Paste text or upload a file, and the Visualizer extracts the IPs or CVE IDs it finds and runs them against GreyNoise.
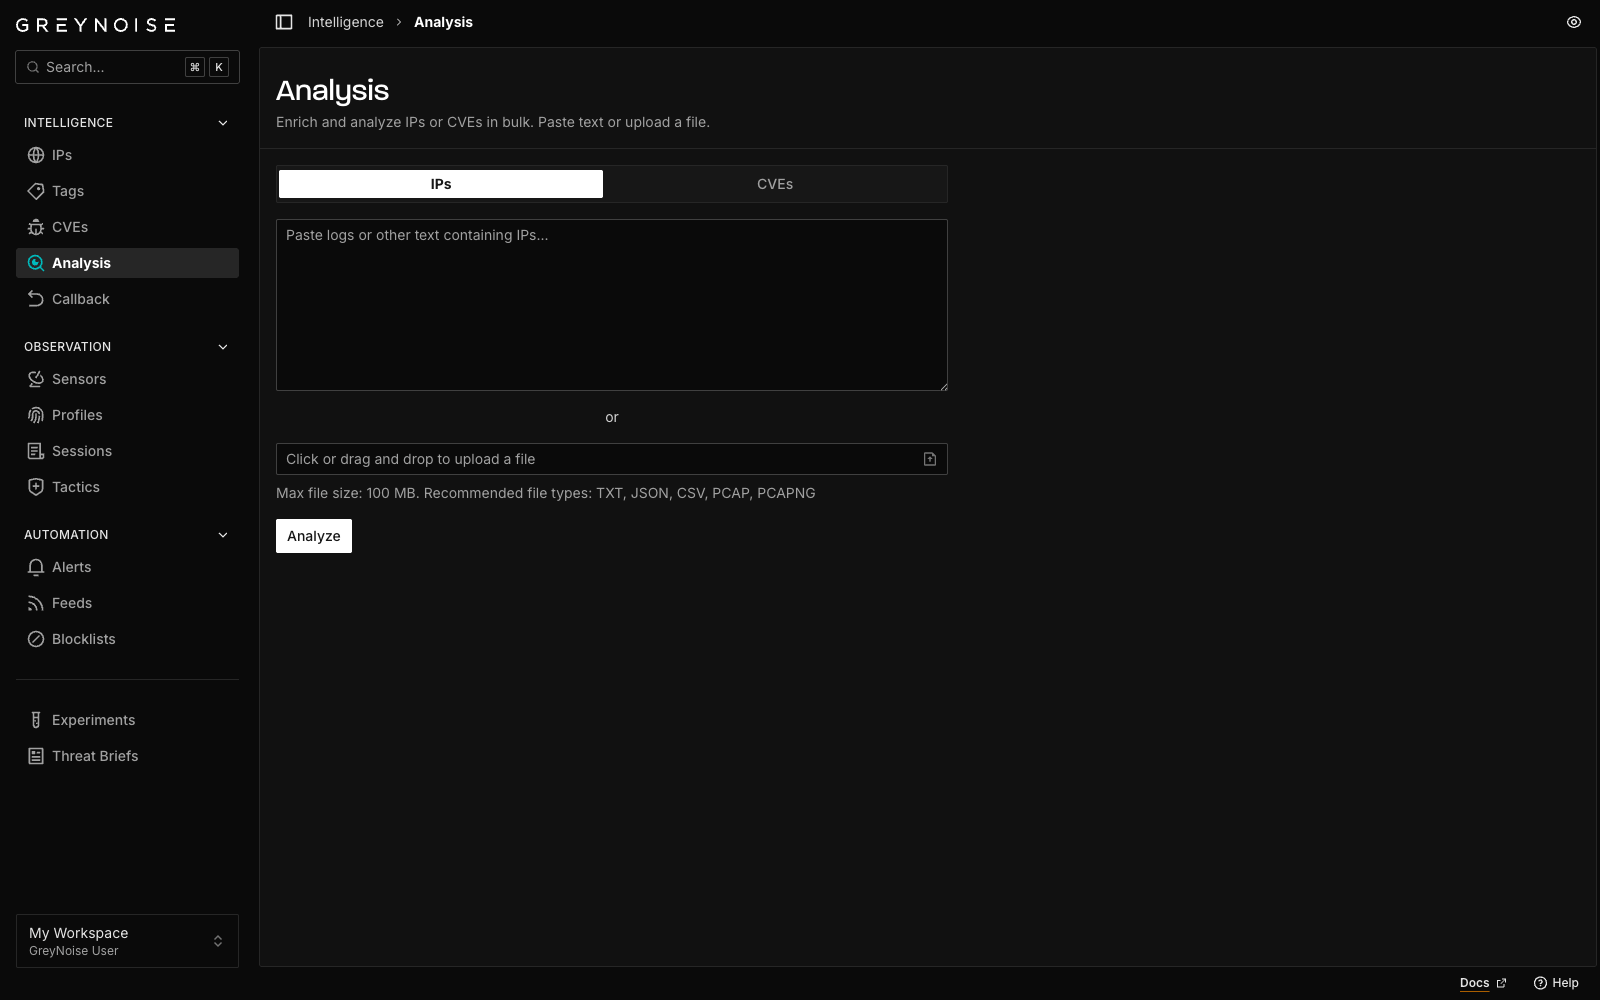
Results open on their own page as a filterable table, which remains available at its own URL after the run completes.
Reviewing Callback IPs
Callback IPs are extracted from exploit payloads observed in the wild: the address an exploit tells a compromised host to contact. The page carries its own query field, a time range, and facets including Stage.
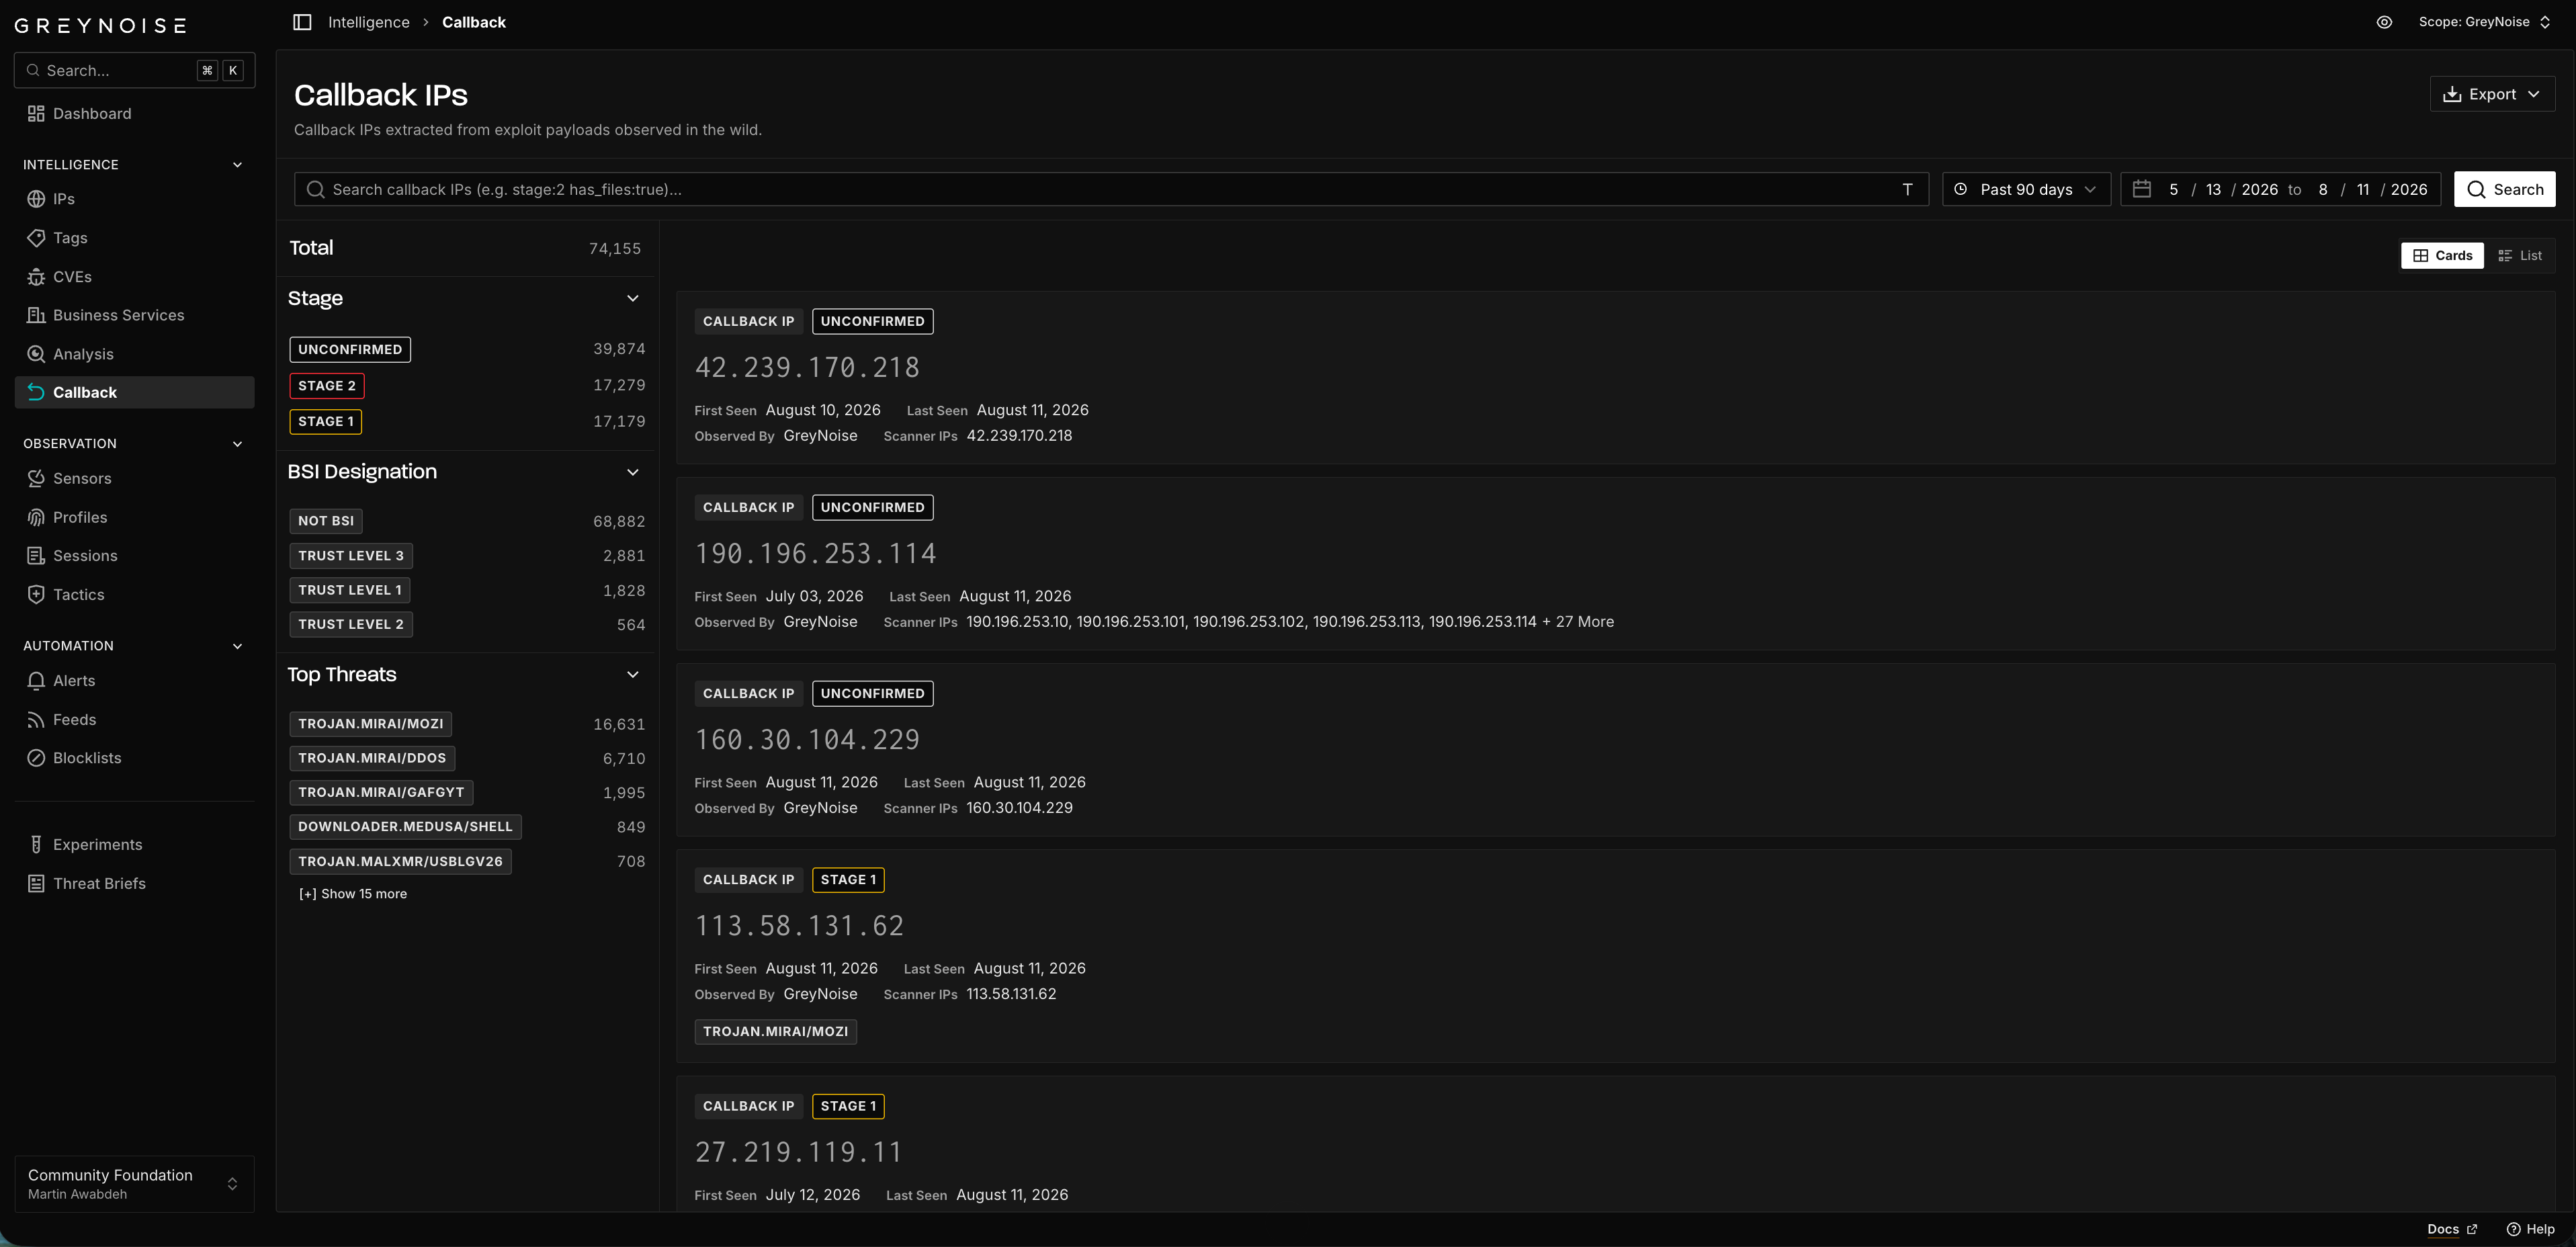
Callback requires the callback module.
Observation
Observation covers the sensors in a workspace and what they capture. Workspaces without sensors see a Get Started item in this section instead.
Deploying and Managing Sensors
The Sensors page lists a workspace's sensors as cards, as a table, or on a map, and is where they are named, assigned a profile, disabled, and exported. A workspace with no sensors sees a setup wizard instead.
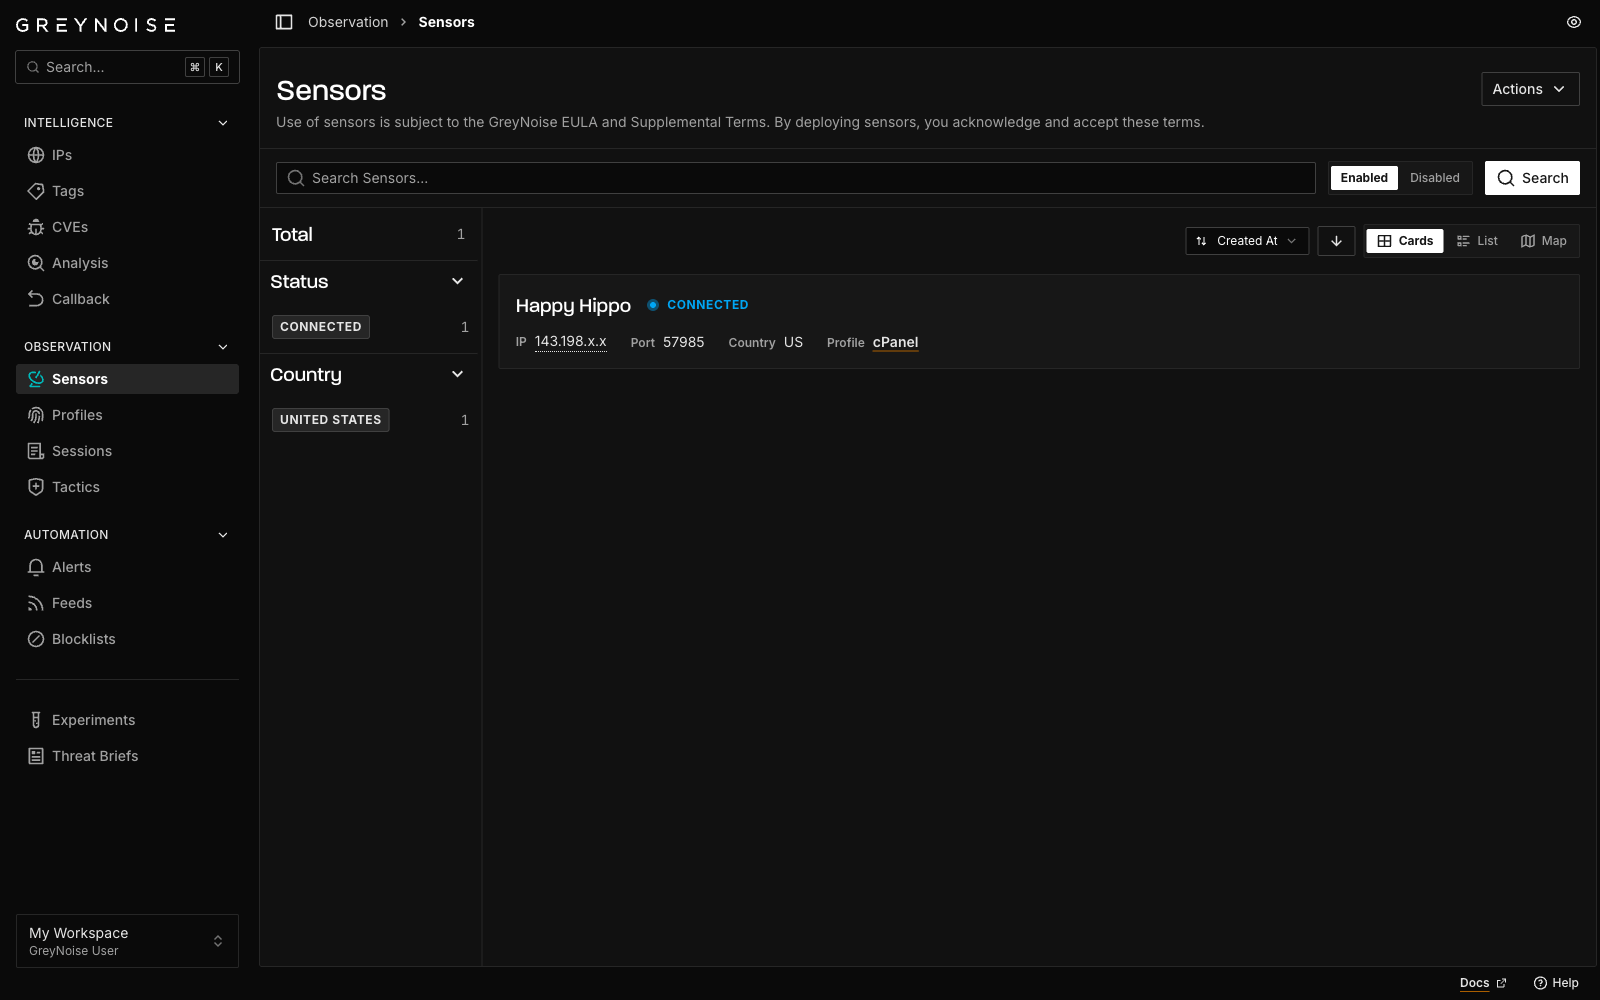
Deployment and troubleshooting are covered in the Sensor Installation Guide and the Swarm FAQs.
Use of sensors is subject to the GreyNoise EULA and Supplemental Terms.
Assigning a Profile
A profile determines what a sensor pretends to be, and therefore what it attracts. Browse and search them on Profile Library. A profile detail page lists its type, protocols, listening ports, related CVEs, and the sensors running it. Assign a profile from either page.
Exploring Sessions
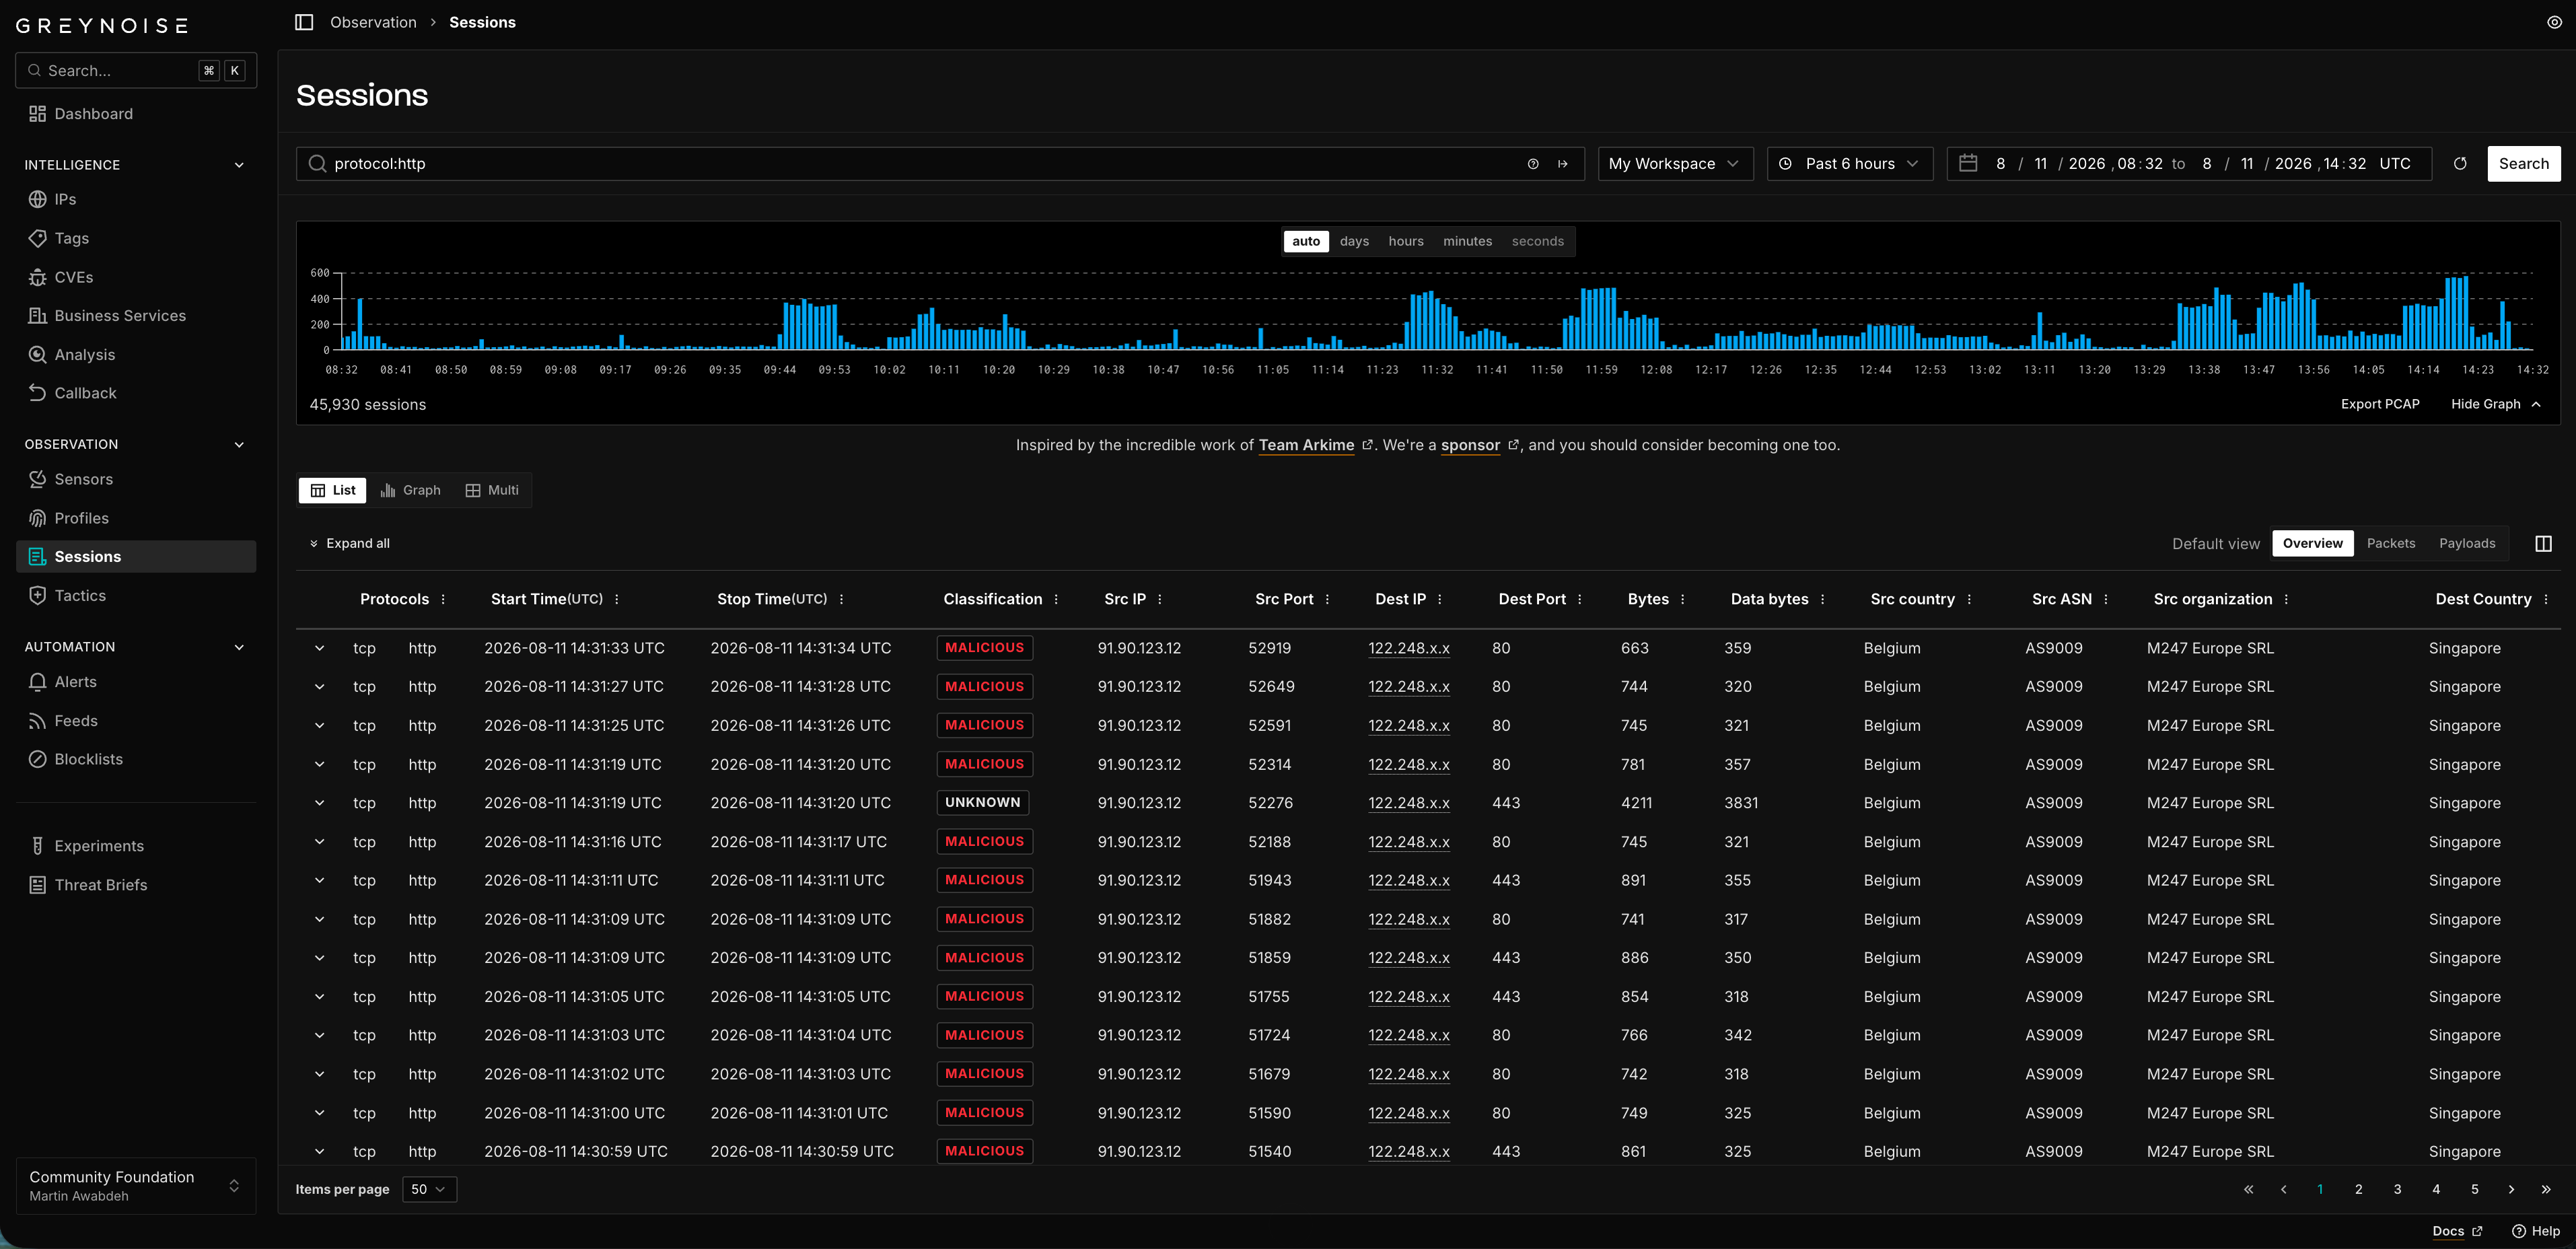
Sessions is the session explorer: the individual interactions sensors recorded. It has its own query language, with a help drawer in the query field, plus a workspace scope selector and a time range. Three views are available: List (an expandable table, where a session's PCAP is also viewed), Graph, and Multi, which tiles several panes 2x2 or 2x1.
Reviewing MITRE ATT&CK Tactics
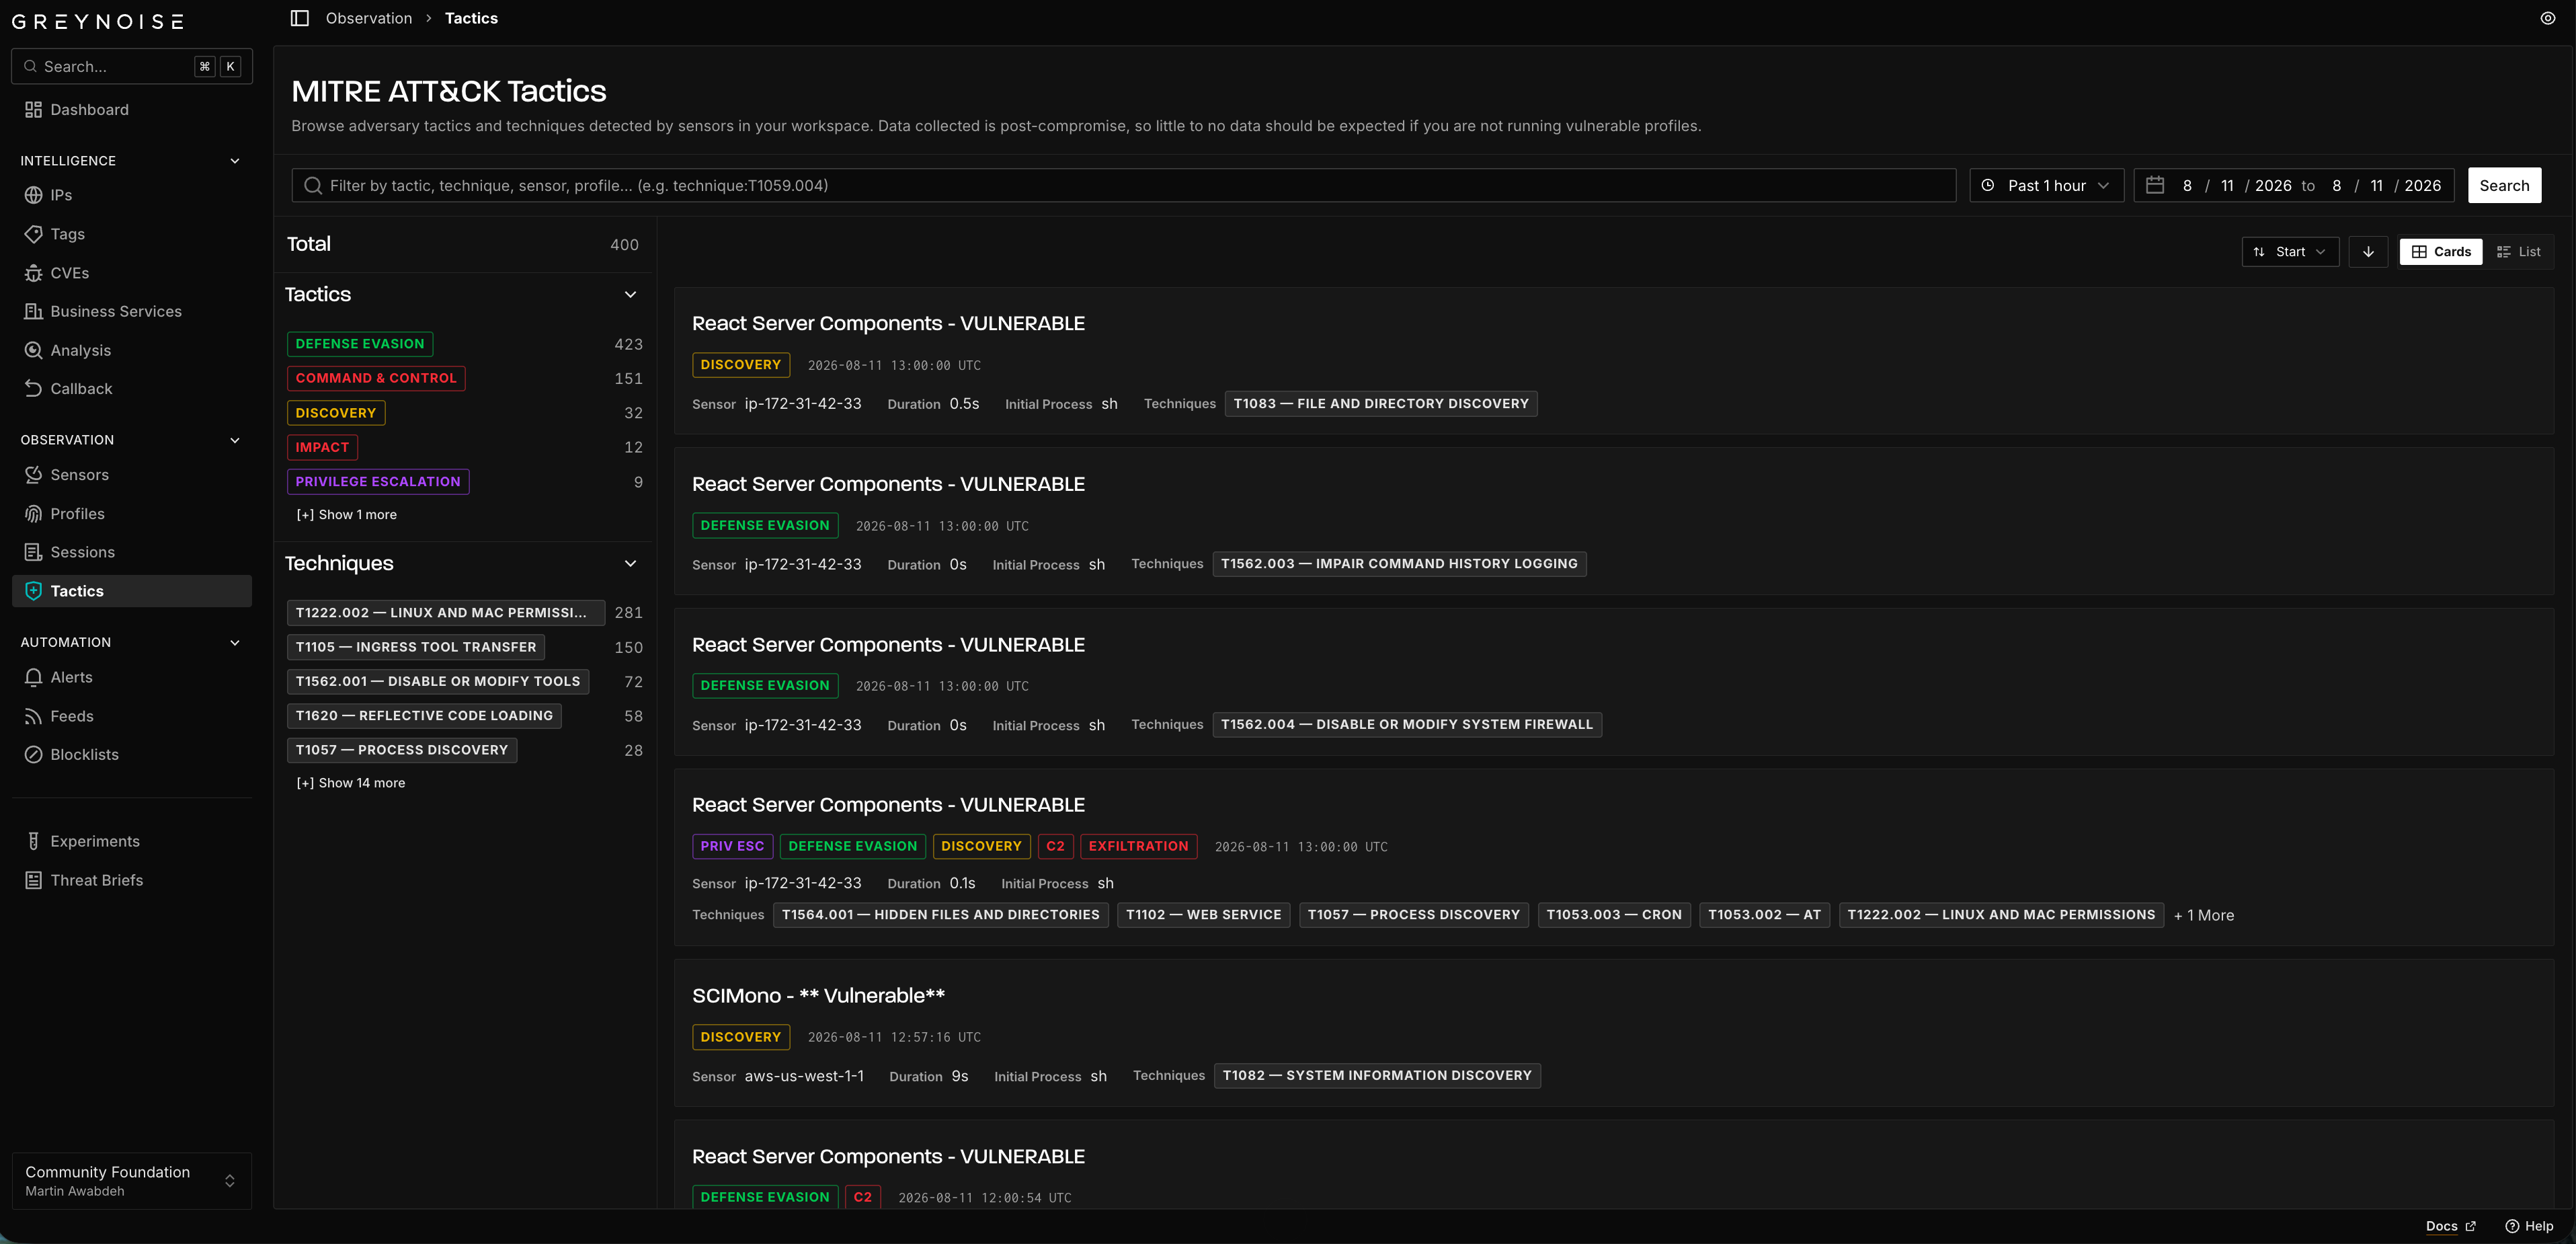
Tactics browses adversary tactics and techniques detected by the sensors in a workspace. The data is post-compromise, so little to no data should be expected without vulnerable profiles running.
A detection detail page lists the techniques observed, along with Commands, Executable Paths, Network Activity, Files, and the related IPs.
Automation
Setting up an Alert
Alerts send an email or webhook notification when GreyNoise observes activity matching a CIDR block or a GNQL query. If a corporation owns CIDR block 54.24.0.0/16, an alert can notify an administrator when any IP in that block begins scanning the internet.
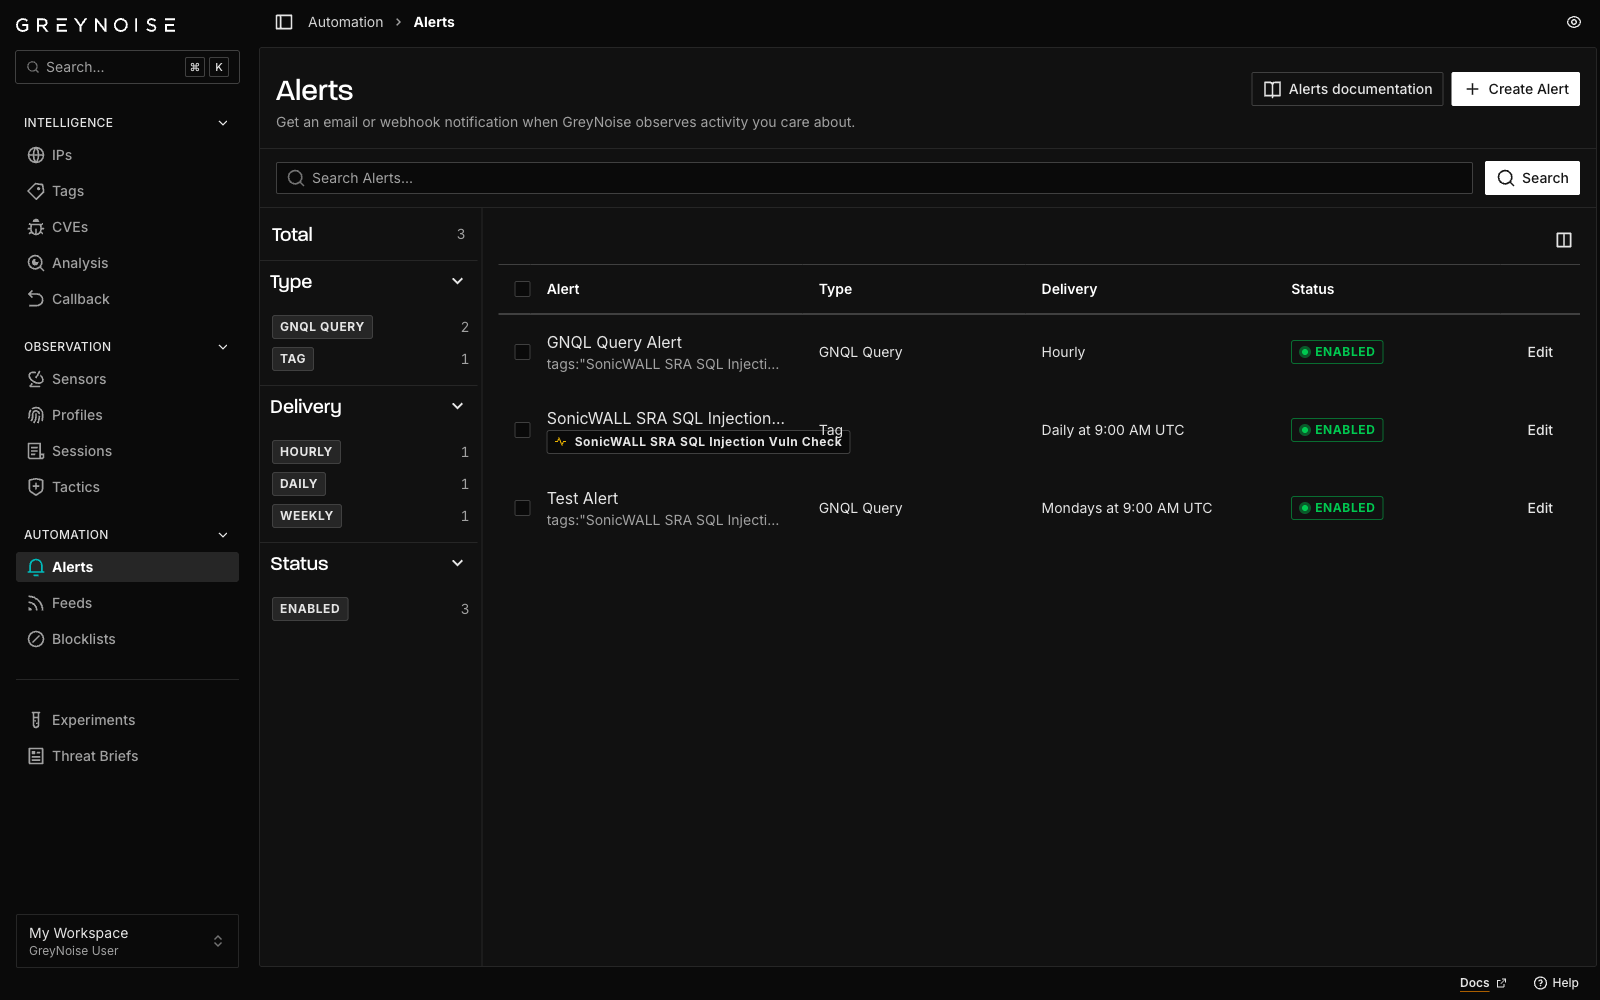
Create an alert from the Alerts page, or from the Automate menu on the Scanner IPs page, which carries the current query into the new alert.
Creating a Feed
Feeds set up a stream of events to power automations. Create a feed from the page header, then use the feed ID and its event viewer to wire it into a downstream system.
Feeds require the feeds module.
Creating a Blocklist
Blocklists produce a list of IPs to block at a firewall, based on a GNQL query. Each can be downloaded, or fetched at a tokenized URL or a URL authenticated with an API key header.
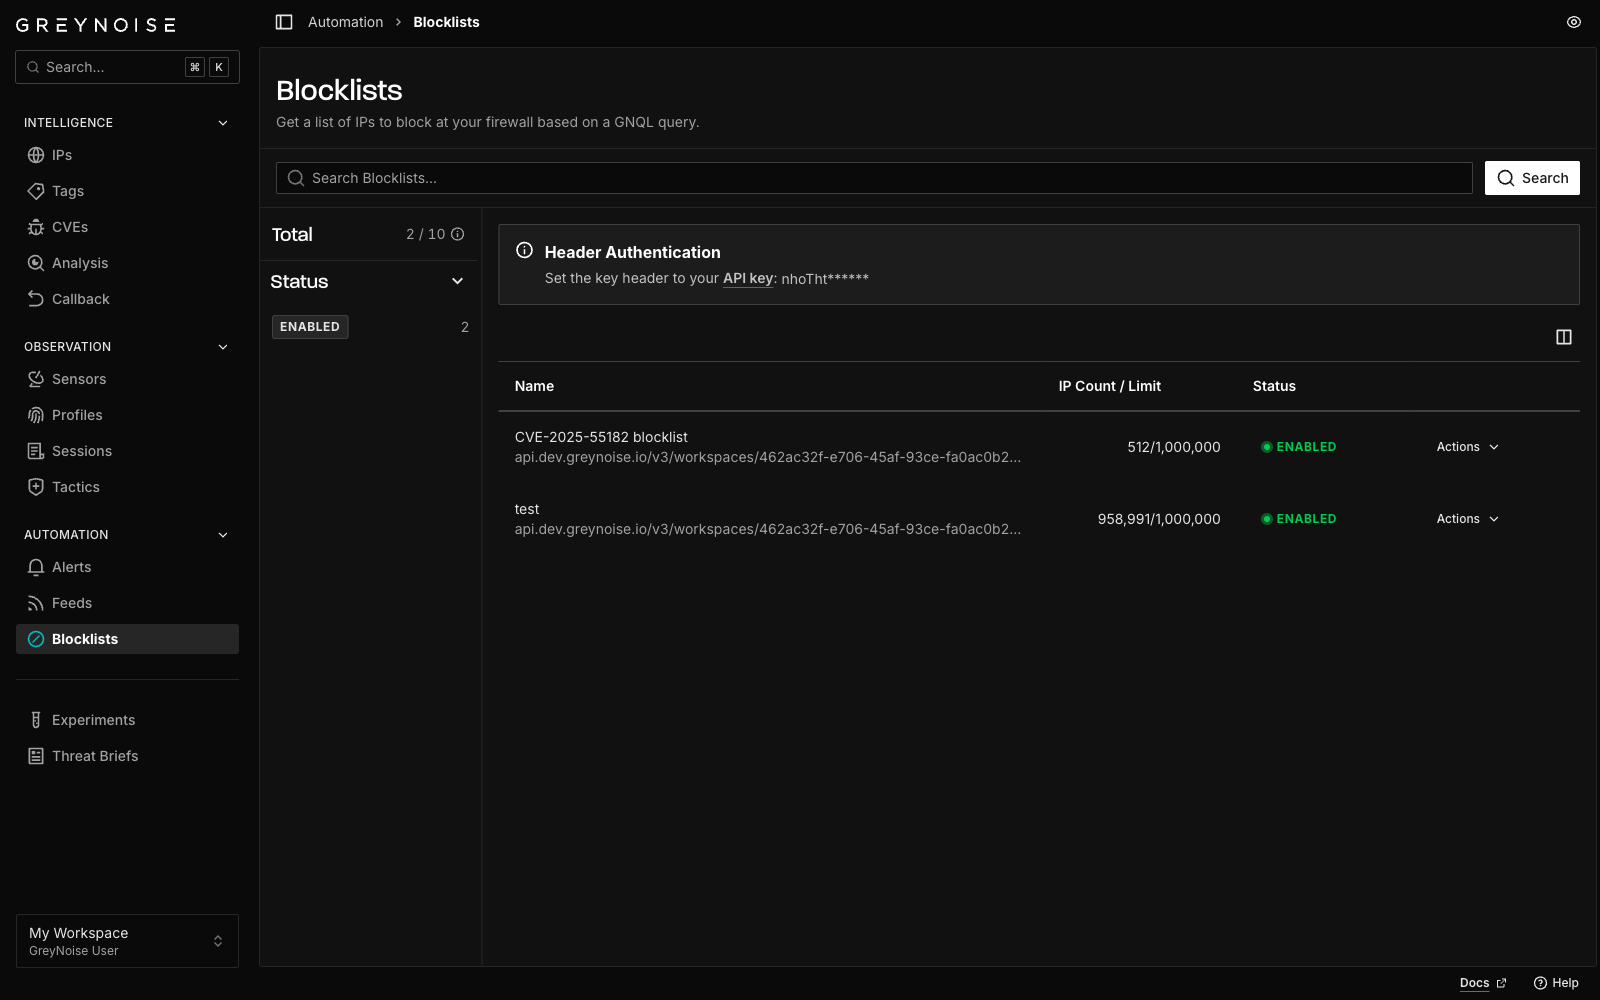
Blocklists can also be created from the Automate menu on the Scanner IPs page and from a tag or CVE detail page.
Dashboards and Threat Briefs
Building a Dashboard
Dashboard, the first item in the sidebar, builds a saved view of the intelligence that matters to a workspace.
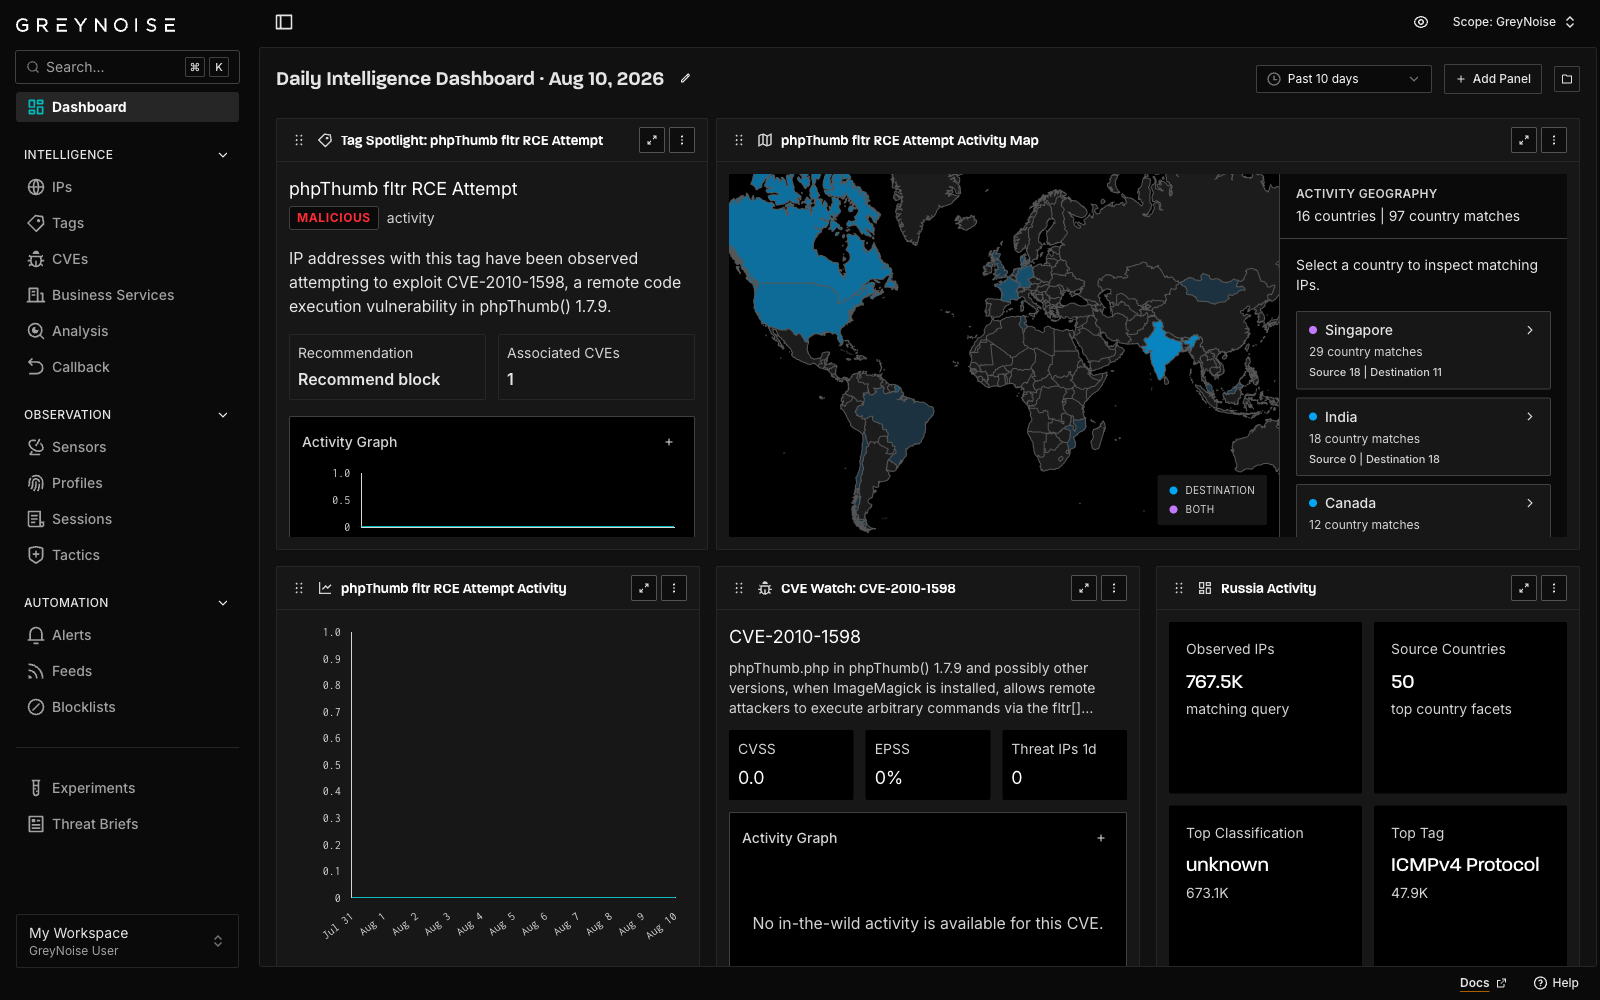
Click Add Panel to add a panel and choose its type.
| Panel | Shows |
|---|---|
| Key Numbers | Headline counts for a query |
| Top Values | The most common values of a field |
| Activity Map | Activity by geography |
| Activity Trend | Activity over time |
| Session Trend | Sensor session volume over time |
| Tag Details | A summary of one tag |
| CVE Details | A summary of one CVE |
Set the time range for the whole dashboard from the header, rename one by clicking its name, and open another from the saved dashboards drawer.
Reading Threat Briefs
Threat Briefs are written for GreyNoise customers and distill what GreyNoise is seeing across the Global Observation Grid (GOG). Workspaces with authoring access can write and publish their own.
Trying Experiments
Experiments links out to experimental tools from GreyNoise Labs. These are previews rather than supported product features, and feedback on them goes to [email protected].
Your Workspace
A workspace holds a plan, its modules, its sensors, and its shared resources. Open the account menu to reach the workspace pages, or to switch workspaces.
Managing Your Workspace
The Workspace page carries the workspace name and ID, the platform plan, the Intelligence Modules enabled on it, weekly search usage against the plan limit, and the API Key.
Sharing a Page
A share link gives another person access to one page without a GreyNoise login. Click Share in the header of a shareable page to create one. The Share Links page lists every link created from a workspace and is where a link is revoked.
Your Account
Account settings belong to the user, not the workspace, and follow an account into every workspace it belongs to. That is why the default workspace is chosen here rather than in workspace settings.
Changing Your Account Settings
Open the account menu and select Settings. The page carries account information and a Preferences form.
| Preference | Effect |
|---|---|
| App Version | Chooses the Classic or the new Visualizer |
| Default Workspace | The workspace selected on login |
| Redact sensitive data | Hides sensor and destination IPs by default |
Click Save Preferences to apply the changes.
Where Features Moved
Links from the Classic Visualizer continue to work and are redirected automatically.
| Classic Visualizer | New Visualizer |
|---|---|
| Query section | Intelligence section |
| Observe section | Observation section |
| Automate section | Automation section |
| Today | IPs |
/query/<query> | /ips?q=<query> |
/ip/<ip> | /ips/<ip> |
| Trends, Tag Trends | Tags, on the Trending, Most Active, and Anomalies views |
| Custom tags list | Tags catalog |
| BSI, RIOT | Business Services |
| CVEs (Recent) | CVEs |
| IP Analysis, CVE Analysis | Analysis, which handles both |
| Explore | Sessions, with List, Graph, and Multi views |
| Compare | The Compare view on the Scanner IPs page |
| Observe > Sensors, Profiles, Tactics | Sensors, Profiles, Tactics |
| Automate > Alerts, Feeds, Blocklists | Alerts, Feeds, Blocklists |
| Workspace > Plan, API Key | Workspace, in the Plan and API Key sections |
| Help | The Docs link in the footer, and the support form beside it |
Sift and the standalone PCAPs page are not part of the new Visualizer. PCAP data recorded by a sensor is still available by expanding the matching session in the Sessions explorer.
Feature Availability
A sidebar reflects the plan and modules attached to that workspace, so an item described in this guide that does not appear is not enabled for it. The Intelligence Modules listed on the Workspace page record what is currently enabled.
Updated 2 months ago