
Sensor Administration Guide
Sensor Tab Overview
When enabled for a user, the Sensors Menu is displayed in the Visualizer Navigation bar.
On the Sensor page, there are three tabs that help with administering your Sensors.
- Sensors - This tab lists all of the sensors currently associated with your account
- Profiles - This tab lists all of the Profiles that are available to you to attach to your Sensors
- PCAPs - This tab allows for PCAP data to be downloaded from your Sensors for analysis
If Sensors Tab isn't VisibleIf you believe you should have a sensor tab in the Visualizer, please be sure to try logging out of the Visualizer, then back in again, and also doing a hard refresh of the page. If that doesn't work, please contact [email protected]
The Sensors Tab
This tab lists all of the sensors currently associated with your account
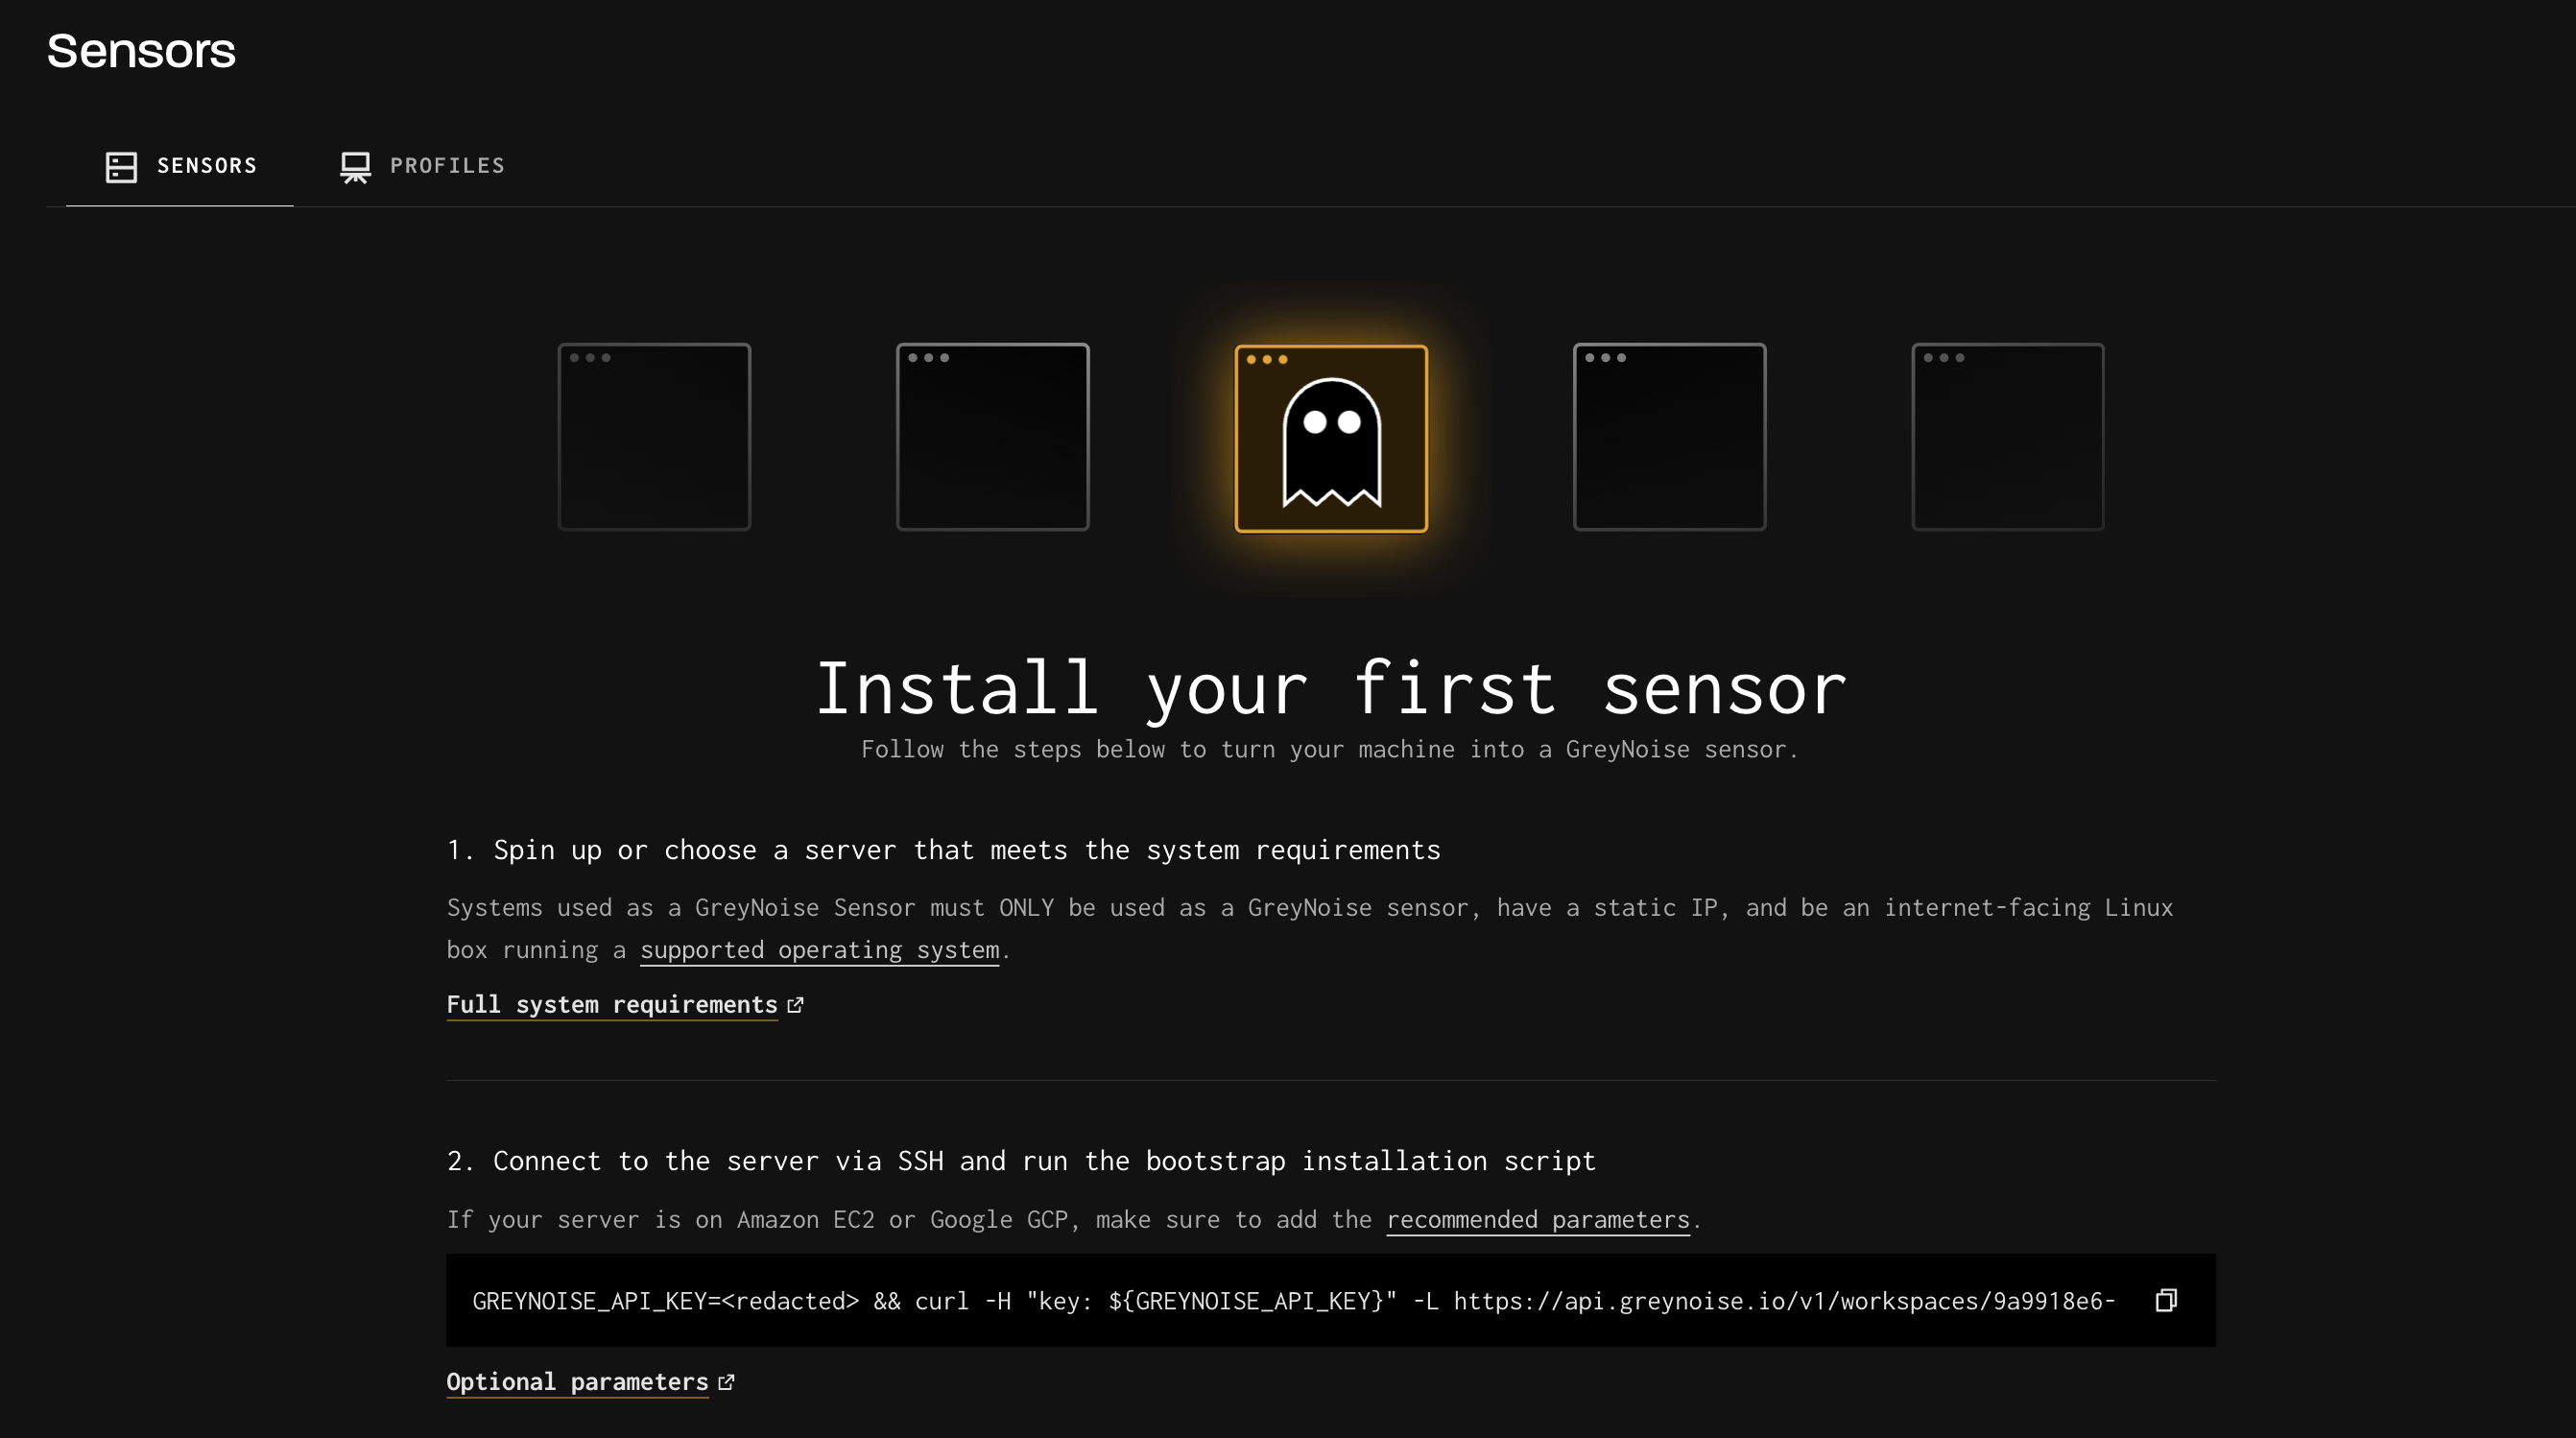
Initial State with No Sensors
Before your account has any sensors in it, you'll only see the link to the installation instructions, which can also be found here
Managing Sensors
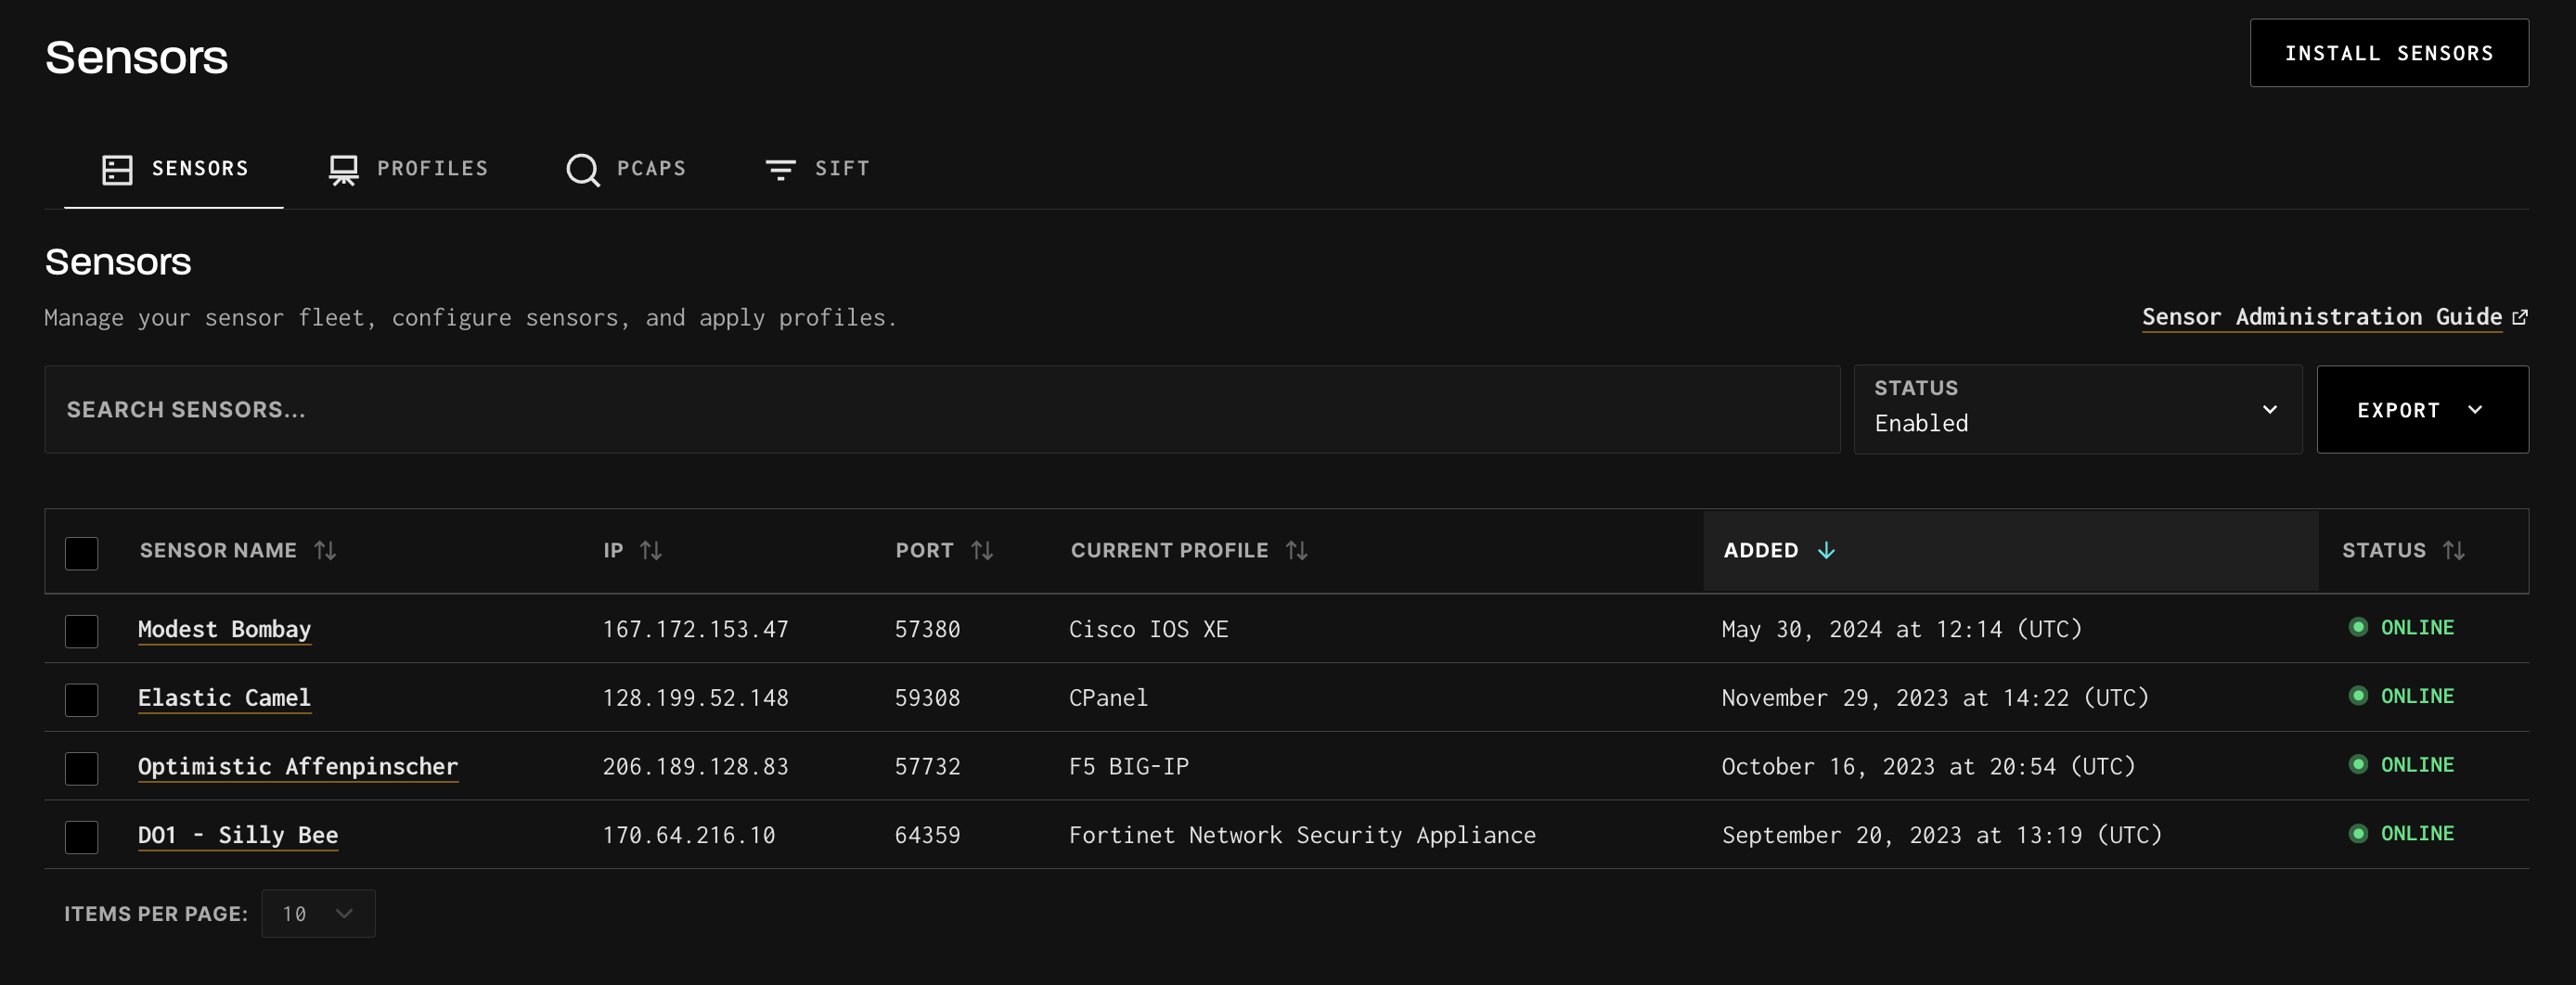
Once sensors begin to populate in the Sensors tab, you'll see them listed with the following details:
- Sensor Name - this is automatically generated but can be updated to any value
- IP Address - this shows the registered address for the sensor, plus the SSH management port set during the installation. It will display in the format:
xxx.xxx.xxx.xxx:yyyyy - Persona - this shows the currently running persona. After an initial install, this will be set to Default and should be changed to begin capturing traffic on the sensor
- Registration Date - this will show the data that the installation was completed on the sensor and it was registered with the GreyNoise Sensor Cloud
- Status - this displays the current status of the sensor and can include:
- ONLINE - the sensor is currently online and functioning as expected
- OFFLINE - the sensor is currently disconnected from the GreyNoise Sensor Cloud and needs attention
- UPDATING PERSONA - the sensor is currently deploying a new persona
Changing the Sensor Name
To update the name of a sensor, click on the Edit link or the row to expand it:
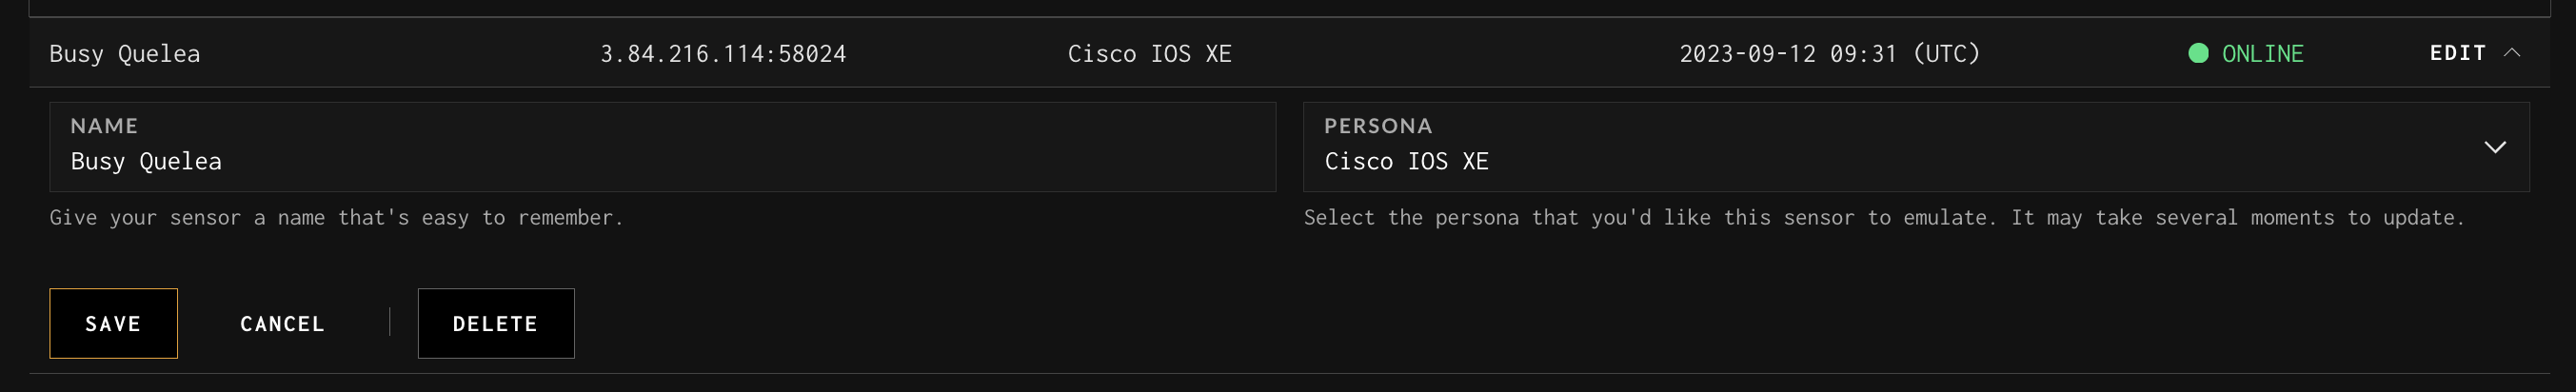
In the Name input, change the name to the new value, then click the Save button. This change will go into effect immediately.
Changing the Sensor Profile
Default Persona Post-InstallAfter the initial run of the bootstrap script, a sensor will be set to use the Default profile. The Default profile is not listening on any ports, but will respond to pings, and send transport protocol rejection packets
To update the profile of a sensor, click on the Edit link or the Row to expand it as was done to update the name.
From the Profile selection box, click on the box to scroll through the list of profiles.
The input box can also be cleared, and you can type a value to filter the list.
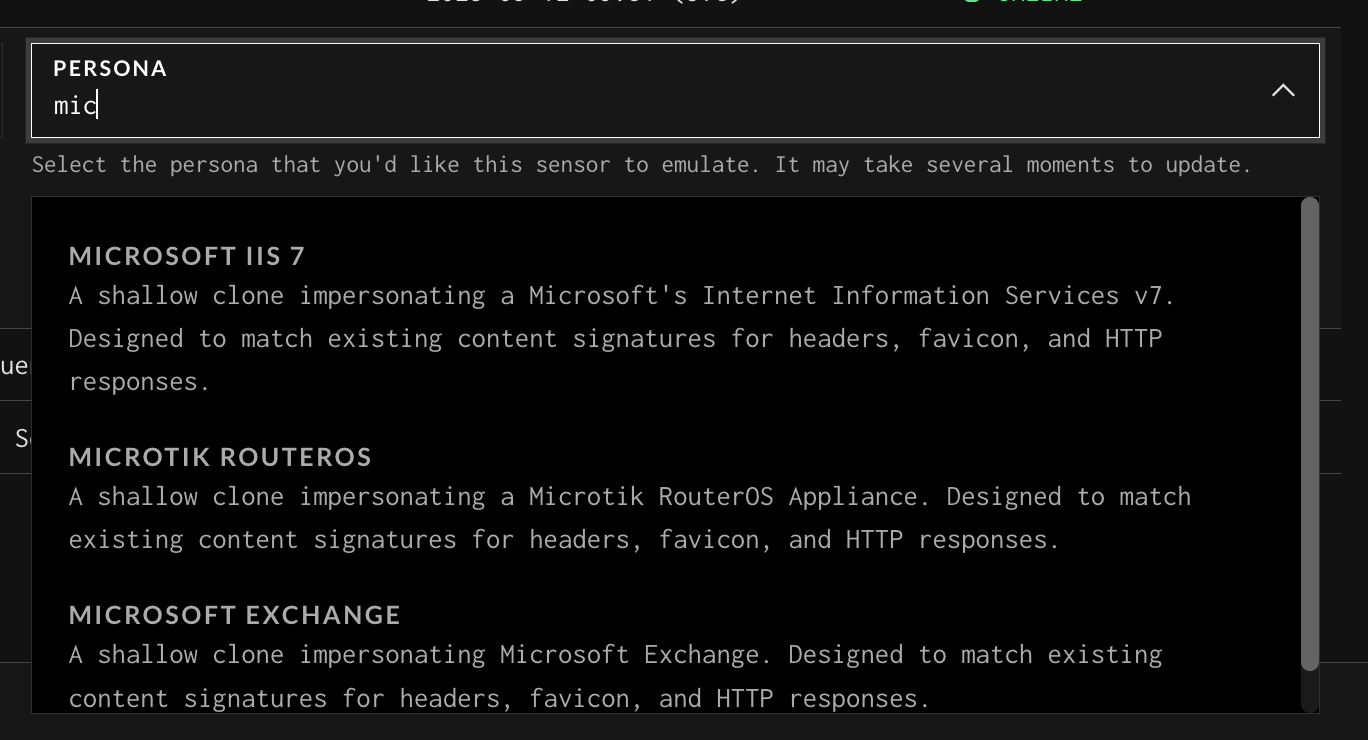
Select the desired profile from the list, then click the Save button to apply the change. The change will take approximately 3-5 minutes to apply.
Deleting a Sensor
Deleting a Sensor only removes it from the GreyNoise CloudBy deleting a sensor, this is only removing the sensor from the GreyNoise Sensor Cloud and does not do anything to the sensor itself. The server that was the sensor will still exist and should be decommissioned using your standard server decommissioning process.
To delete a sensor, click on the Edit link or the Row to expand it as was done to update the name.
Click on the Delete button, then click on the Yes, Delete option to confirm you want to continue. This will immediately remove the sensor from your list of sensors.
The Profiles Tab
This tab lists all of the Profiles that are available to you to attach to your Sensors
The Profiles list includes the following information for each Profile:
- Name - the name of the Profile
- Description - a brief description of what the Profile provides
- Protocol - a list of the protocols that are enabled on this Profile
- Category - a list of the categories that this Profile is tagged with
- Author - the person or organization that contributed this Profile
- Published Date - the date when this Profile was added to the catalog
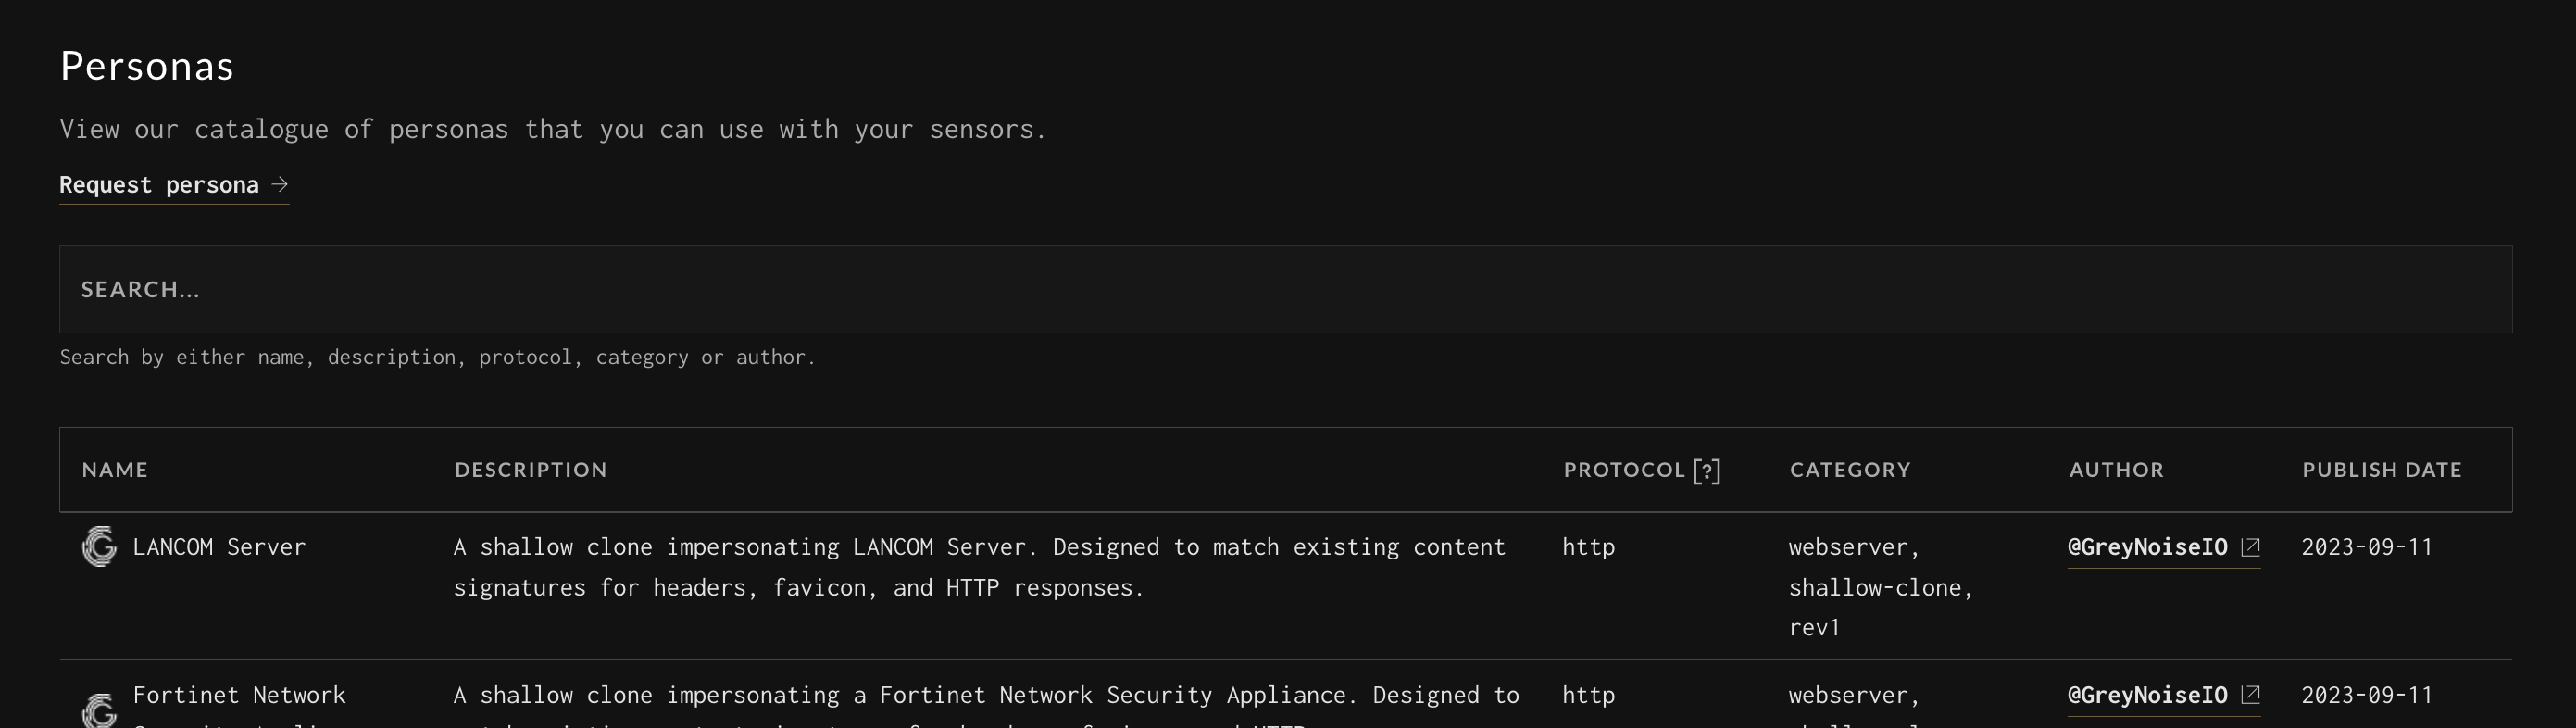
Searching Profiles
The Profile tab provides a search box that can be used to search the catalog. The search will look for the entered value in the name, description, protocol, category, or author values.
The PCAPs Tab
This tab allows PCAP data to be downloaded from your Sensors for analysis.
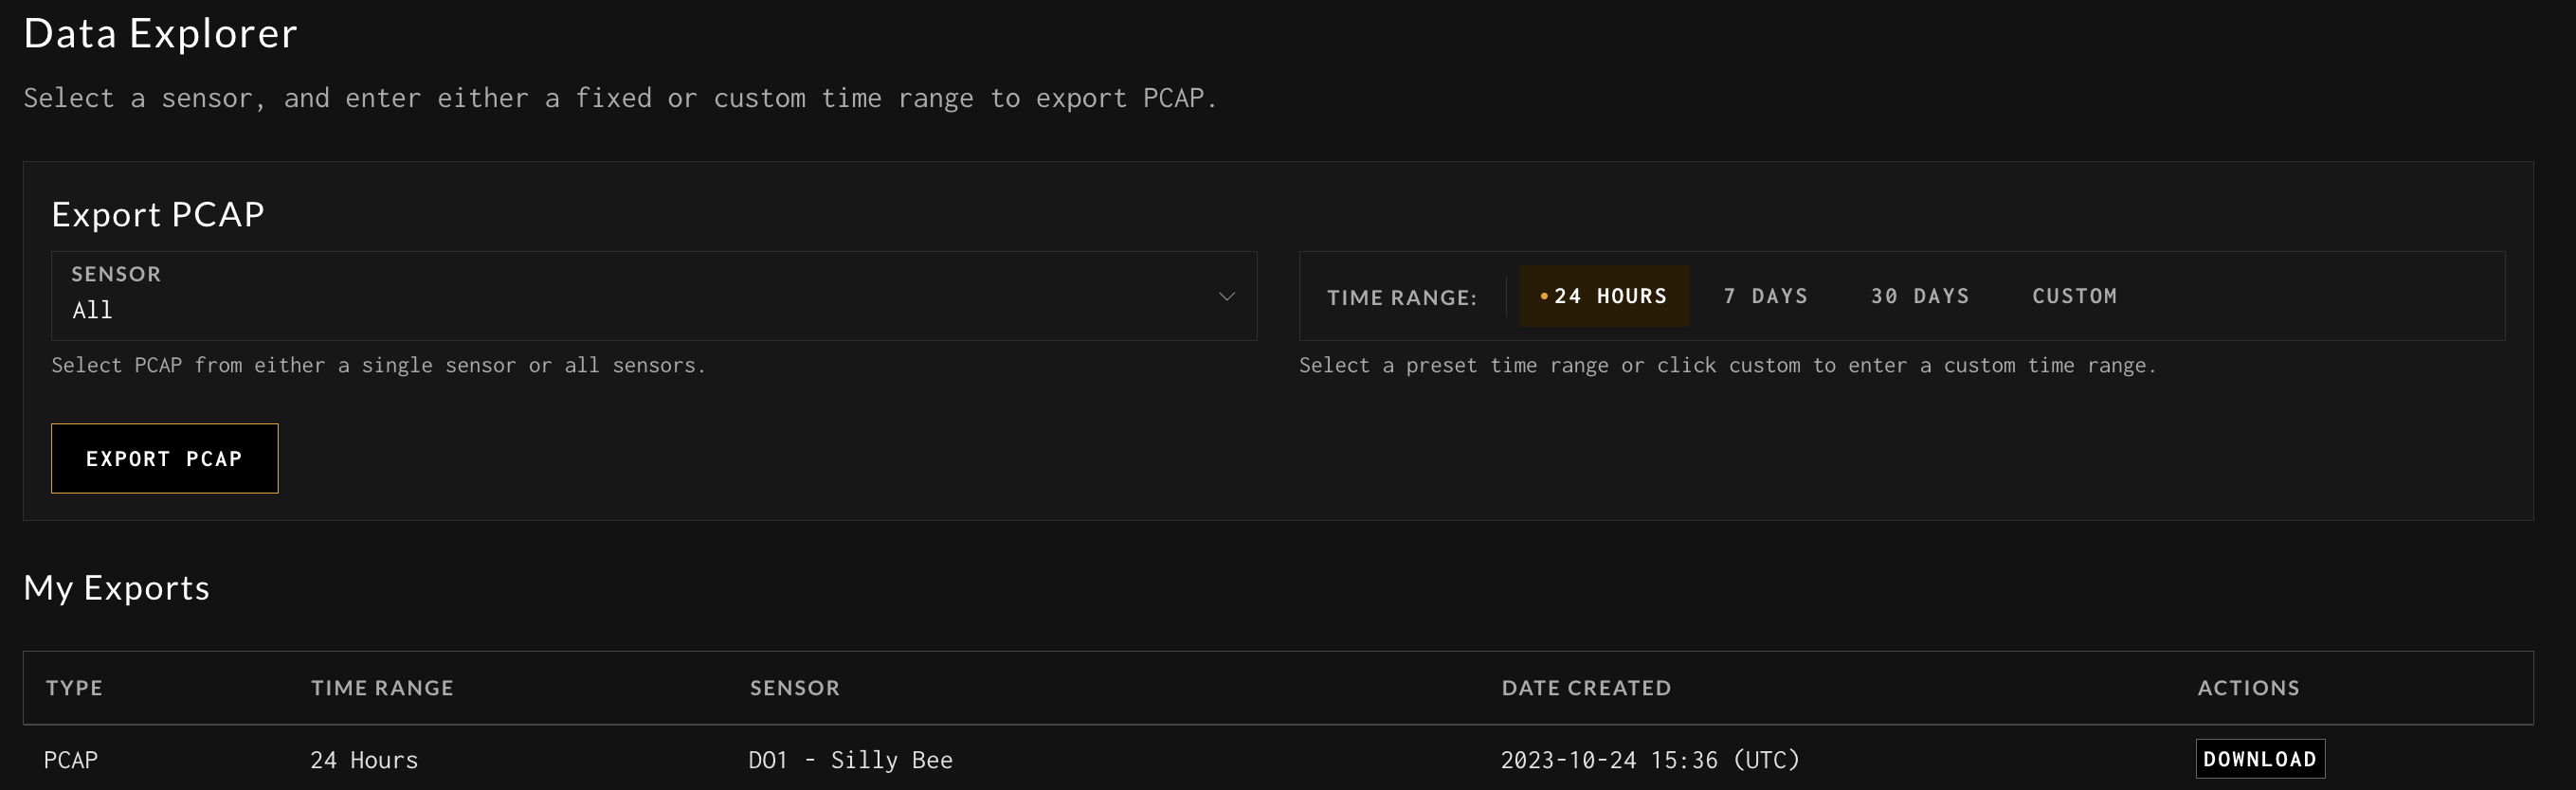
Creating an Export
To request an export be generated:
- In the Sensor dropdown, select either a specific sensor or the ALL option
- For the Time Range, use one of the default selections (24h, 7d or 30d) or select Custom to enter a customer timeframe
- Press the Export PCAP button to submit the request
The request will take a few minutes to generate and be added to the My Exports list.
The My Exports table includes the following details about each export:
- Type - the type of export requested
- Time Range - the time frame option selected when the request was submitted
- Sensor - the selected sensor option when the request was submitted
- Date Created - when the request was submitted
- Actions - the list of actions that can be taken with the export
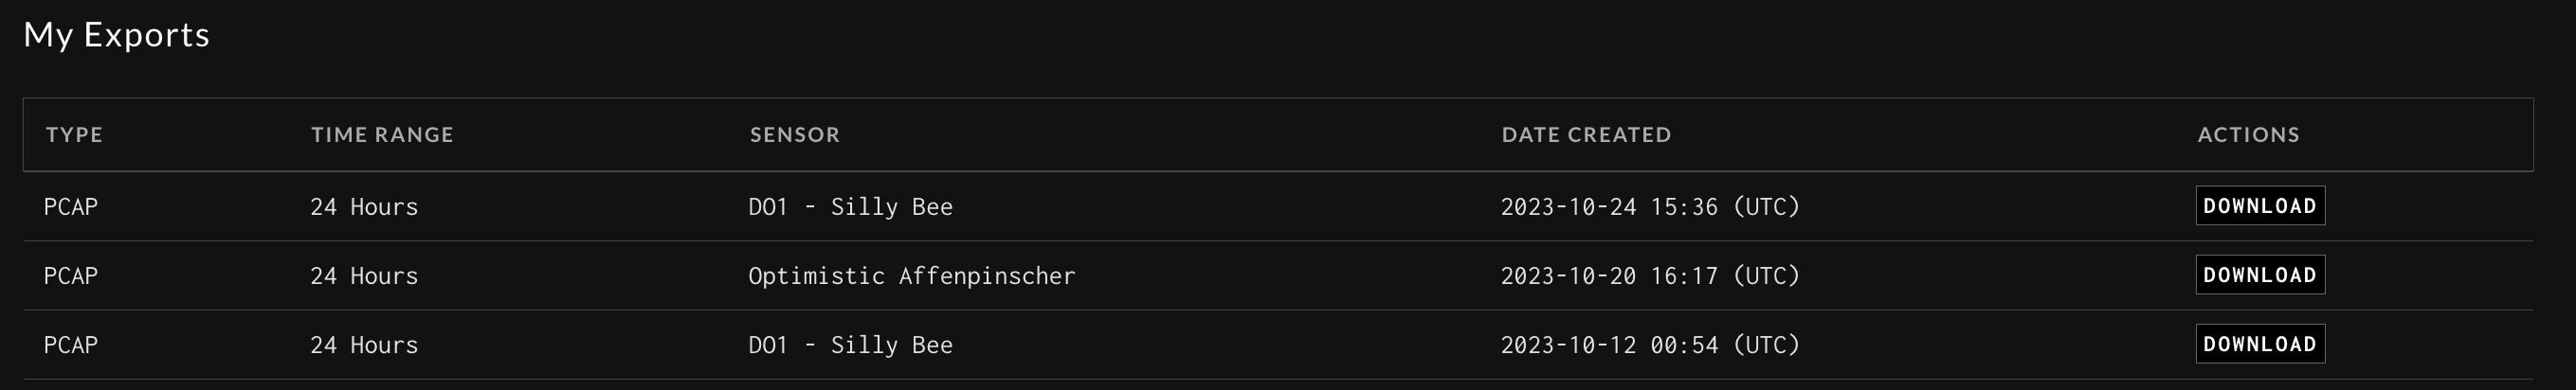
Downloading an Export
Once an export has been generated, it can be downloaded from the Data Explorer by clicking the associated download action for the export.
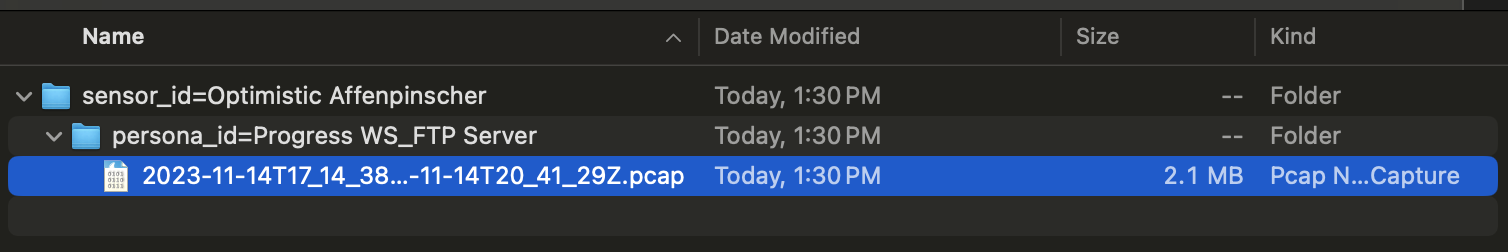
Exported PCAP File Structure
Once a PCAP export has been downloaded, the ZIP file will contain a consolidated PCAP file of the requested data. Multiple files will be created if the total file size would exceed 500M.
The PCAP files will also be nested in the archive to identify which sensor and persona the PCAP relates to:
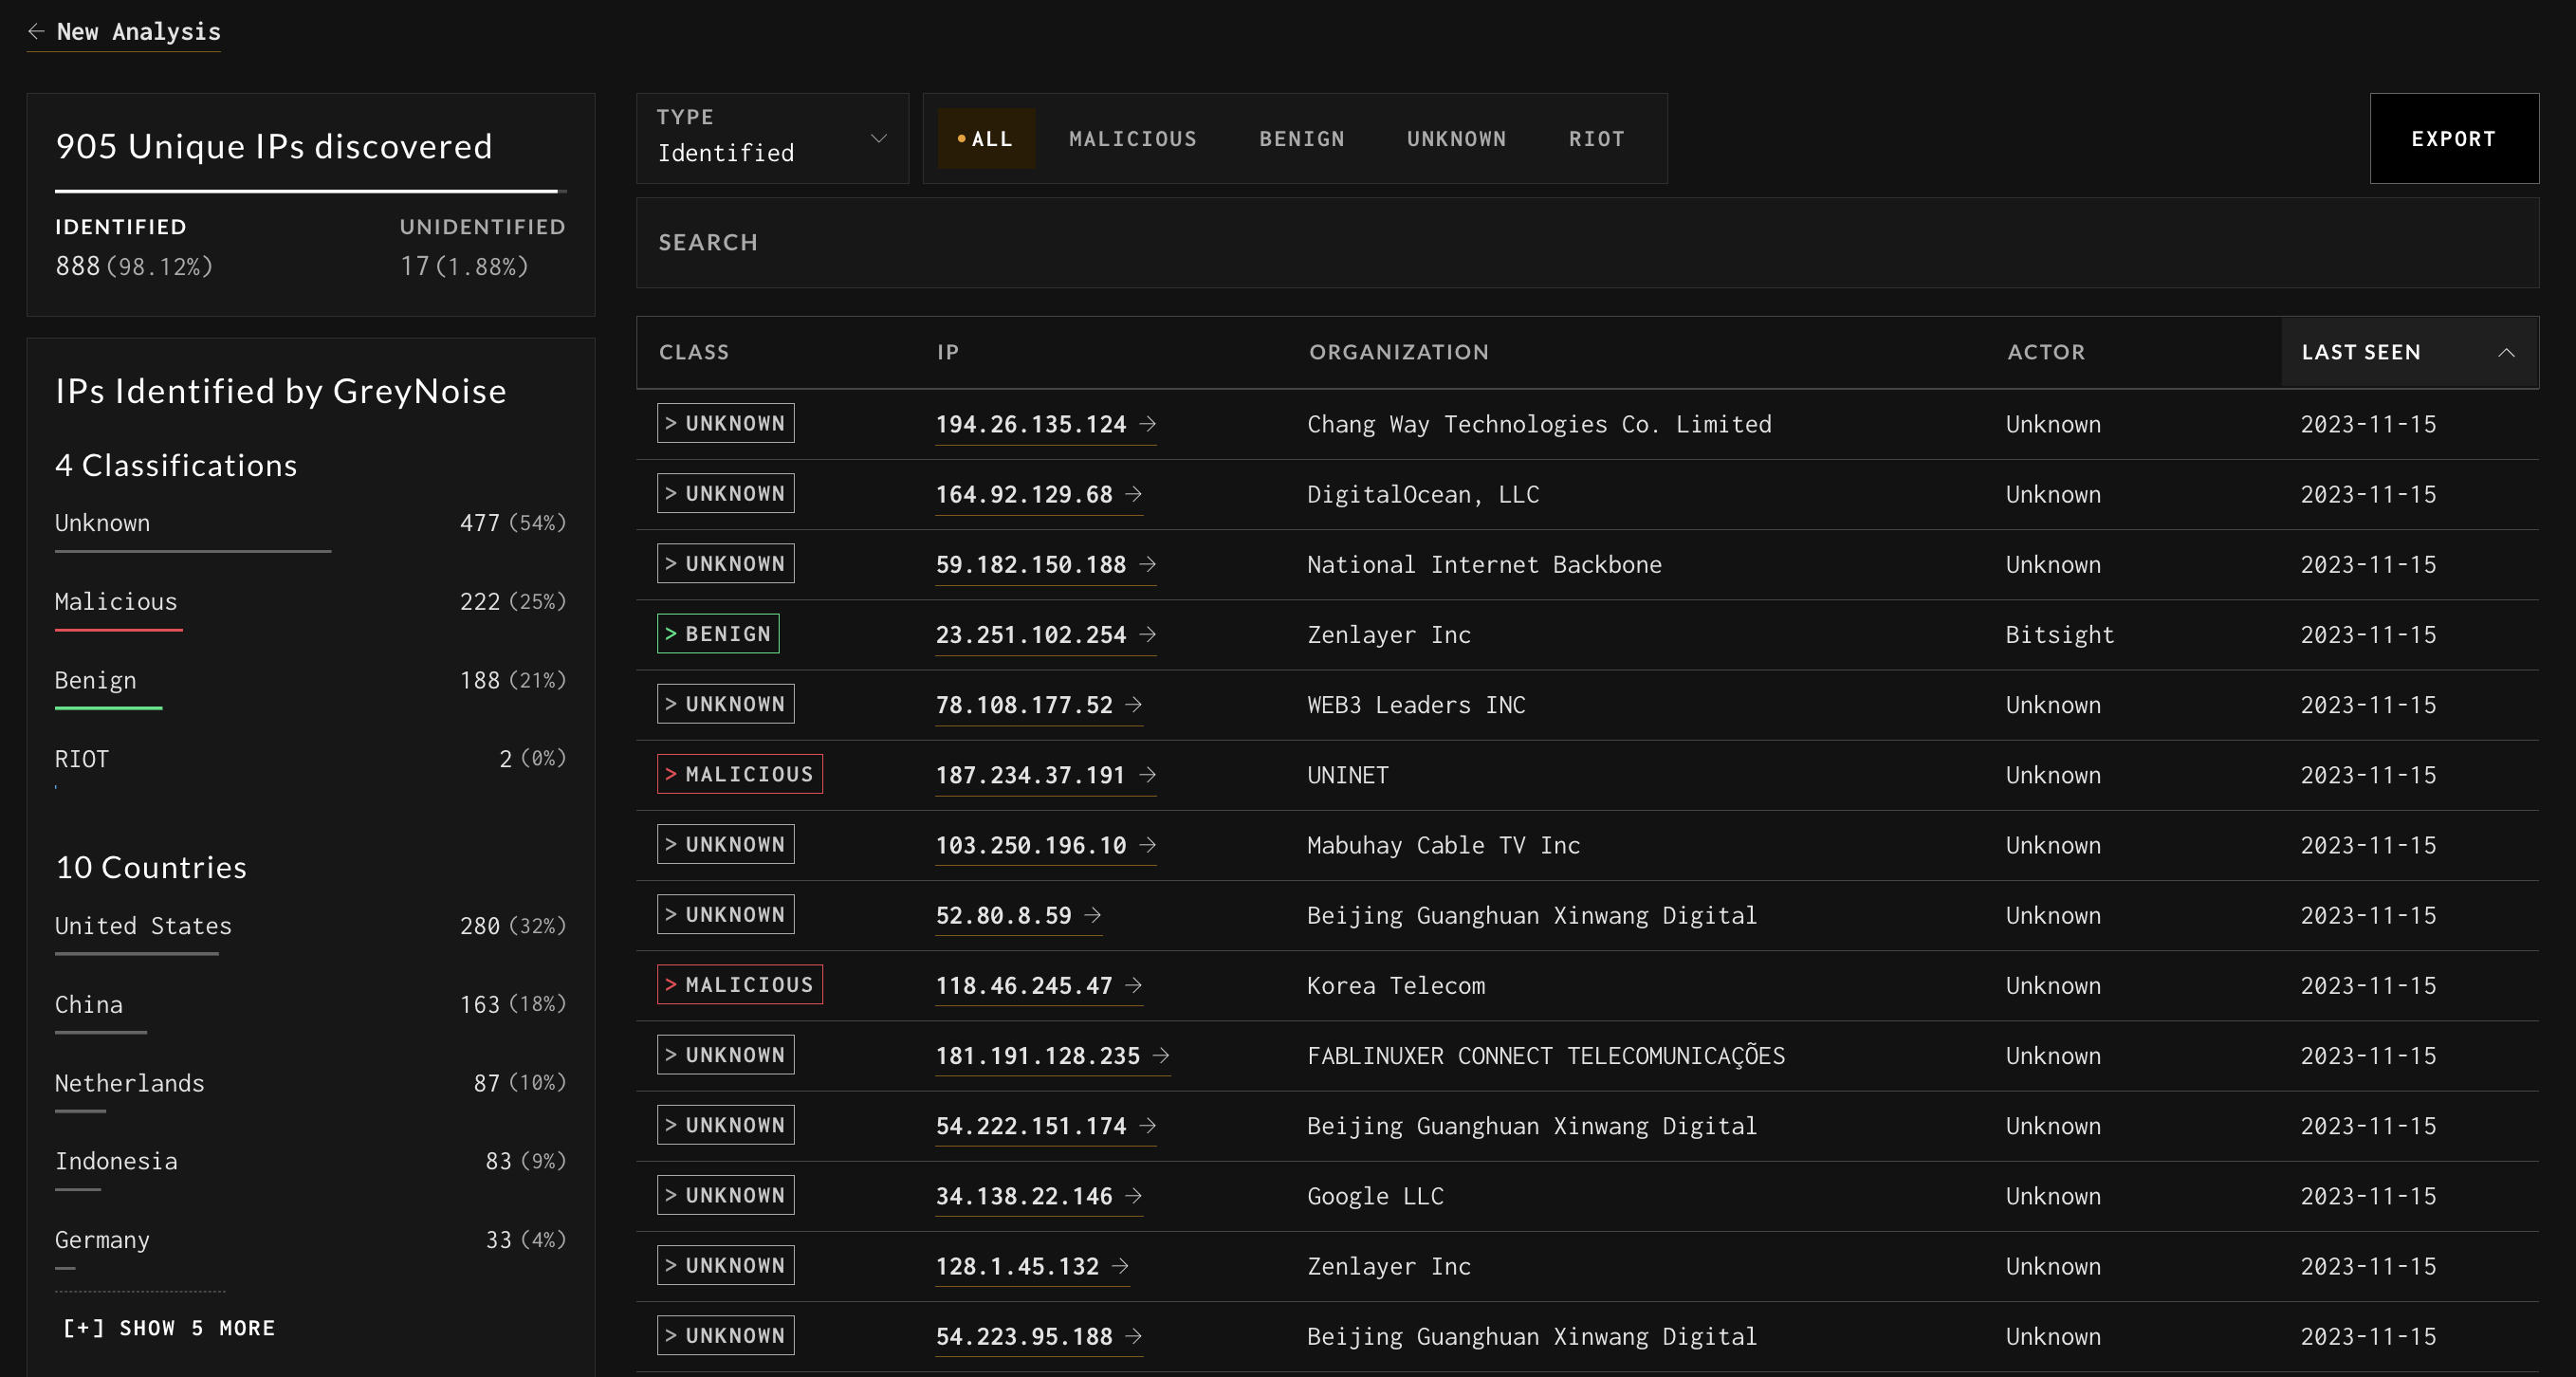
Using the Analysis Tool on an Export
The GreyNoise Analysis tool supports uploading a PCAP file for analysis.
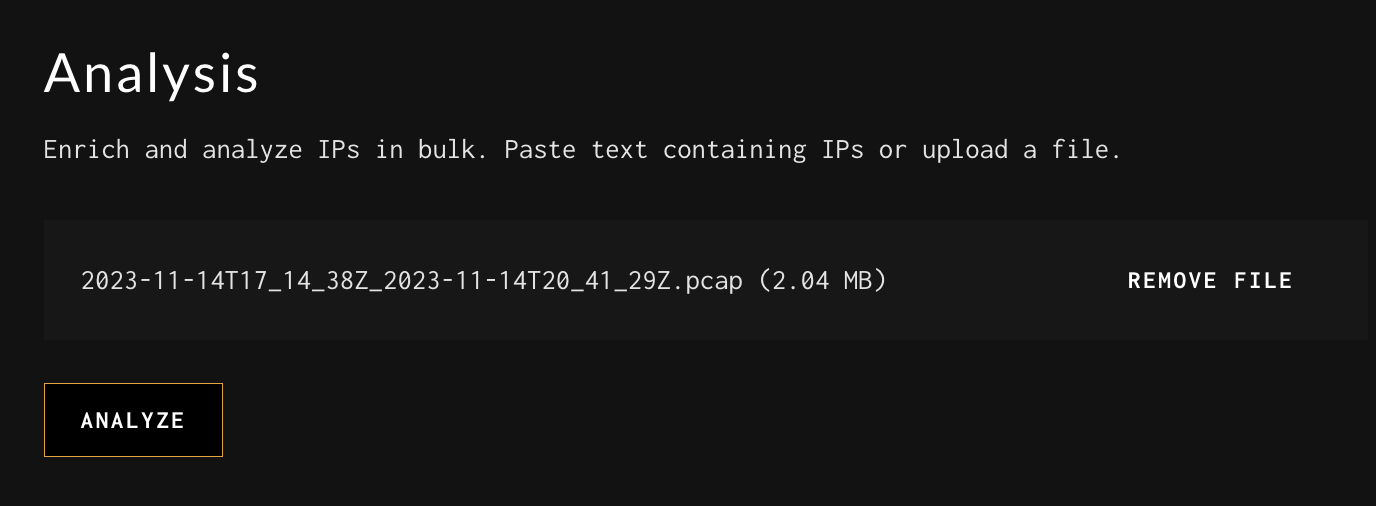
The tool will parse all available IPv4 public IPs out of the PCAP and return a GreyNoise analysis of each of those IPs.
Updated 2 months ago